
Chapter 6 - Energy Sustainability
Part 3 - Electricity: Transmission, Distribution and Economics
Delivering Electricity to End Users
Electricity Markets and the Future of Electricity
In order for the world to continue to supply electricity to meet the ever-growing demands, electricity, and its generation, will have to make some changes. There will have to be a higher efficiency on all facets of generation and use, and some of the major considerations include:
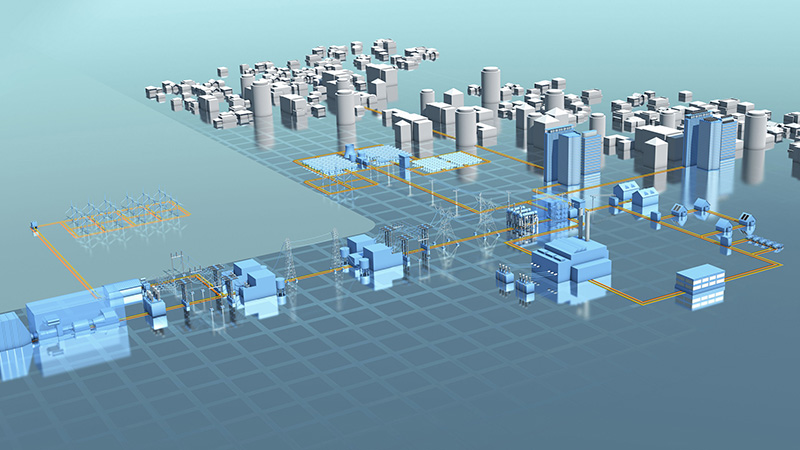
- Incorporation of smart grids will help to modernize the electricity grid, and improve reliability and efficiency, among other things;
- Price signals – prices to which customers can respond in a reasonable time frame – will change how electricity is provided at a retail level;
- Including fast-response demand-side resources to participate in capacity and other ancillary service markets will complement supply;
- Combined heat and power (CHP) by using waste heat is one of the easiest and most financially rewarding means to improve efficiency and lower costs;
- Distributed generation combines right-sizing with the economies of mass production, and standardized rules, making DG one of the more promising technological innovations for the future;
- Energy storage and vehicle-to-grid technologies will need to improve performance and economics to be widely adopted, but they do have the potential to change the nature of electricity in a fundamental way;
- And improved technology, lower costs and increasing issues with fossil fuels will bring more renewables, a broader diversity into the power mix.
The US Utility service market share by ownership, as of a 2009 study, showed 72% of the utilities were investor owned, 12% were cooperatives, 11% were municipal utilities, with a 5% share being held by “other” government-owned utilities (BPA, WAPA, TVA). US power production in 2008, by producer type is about 60% electric utilities, 33% independent power producers, with combined heat and power (CHP) being responsible for 8% of the power produced.
Who Regulates What?
- FERC - Federal Energy Regulatory Commission – regulates wholesale market, generators and transmission rate.
- NERC – National Electric Reliability Corporation (voluntary) – reliability, technical standards
- State Utility Commissions (appointed) – regulates retail rates and sets policy for investor-owned utilities; some oversee energy efficiency programs
- Local jurisdictions: City councils/public utility boards
- US EPA – power plant emissions and environmental compliance
- RTOs – regional transmission organizations, and ISOs – independent system operators – regulate market rules, technical standards, grid operations
- US DOE/EIA – reporting, research
- Bureau of Reclamation – hydropower regulation
- Dept of Interior, BLM – land issues such as wind and solar siting
Electricity Markets in the US – How Much, Where?
The ICE – Intercontinental Exchange – is a major execution venue for over the counter trading for prompt or Day Ahead markets in North American power. Currently, more than two dozen hubs (delivery points) can be traded throughout the major FERC power regions in North America. ICE’s over the counter participants are some of the world’s largest energy companies, financial institutions and other active members in the global commodity markets. Participants include refineries, power stations, utilities, chemical and transportation companies, banks and hedge funds as well as other energy and financial industry professionals. Transactions on the ICE platform represent approximately 70% of the next day’s trading activity.
Regional Markets
Regional markets often have overlapping markets, with some ISO markets overlapping more than one FERC market: for example, the California ISO (CAISO) overlaps three FERC markets. In general, supply for these traditional markets is based mainly on fossil fuels, with a dwindling reserve capacity, and an increasing demand. Price is also increasing, although wholesale electricity prices in the US vary by region. Prices are driven by the fuel source mix, transmission congestion, and the supply- demand balance.
ISOs and RTOs
ISOs and RTOs conduct transmission and reliability markets, matching supply with demand, and fine-tuning the flow of electricity. ISOs grew out of FERC orders # 888/889 (1996), where FERC suggested the concept of an ISO as one way for existing tight power pools to satisfy the requirement of providing non-discriminatory access to transmission. ISOs are like escrow companies, and act as a clearinghouse for energy transactions, but never actually buying or selling power themselves. The markets allow the ISO to make adjustments in power deliveries in response to changes in energy consumption.
RTOs grew out of FERC Order #2000 (1999), in which FERC encouraged the voluntary formation of Regional Transmission Organizations to administer the transmission grid on a regional basis, throughout North America. Order #2000 listed 12 characteristics and functions that must be satisfied for an entity to qualify as an RTO.
Reliability
RTOs and ISOs operate reliability markets in order to ensure grid reliability. Power plant owners look at the capabilities of their assets in all of these markets to maximize their value when deciding how to operate them. Ancillary services markets sell replacement reserves, "spinning" reserves, "non-spinning" reserves and regulation reserves. Transmission markets allocate space on transmission lines. Real-time Imbalance markets sell supplemental energy that is used to accommodate energy use just moments before it occurs. Ancillary service markets and transmission markets have transactions that occur a day ahead and an hour ahead of actual customer use/delivery, while Real-Time Imbalance energy is bought or sold every 10 minutes. These markets combined are less than 10 percent of total energy markets in California, for example, but they do keep energy flow consistent.
Price Regulation
Although energy prices have been increasing recently, the national average price for electricity in 2006 was less than it was in 1980, when adjusted for inflation. As part of the transition to competition, many states froze customer’s bills, typically for 20 years, with the first rate caps being put in place in 1997. The last of these caps will expire in 2011.
What you pay for on an Electric Bill
The actual generation of the power comprises about 46% of the bill, with distribution costing about 35%. Transmission costs are at about 5%, and public programs, such as low-income ratepayer assistance and energy efficiency, comprise about 7% of the bill. Ongoing CTC – competition transition charge - is the charge for the cost of electricity that is in excess of the market price (2%). Various other charges are utility/area – specific.
Part 3 - Electricity: Transmission, Distribution and Economics
Delivering Electricity to End Users
A. Basic Structure of Electric Power System
B. Transformer Basics and Losses
C. Transmission Lines and Grid Operations
D. Environmental, Health and Safety Issues – T&D
E. System Losses Weigh Heavily on Electricity Systems in Developing Countries
F. A Revolution in the Electricity Sector?
G. Small-Scale Power: Distributed Generation
Summary: Smart-Grid: A Game-Changing Technology
Electricity Markets and the Future of Electricity
Part 3 - Electricity: Transmission, Distribution and Economics (BACK TO START)
(Adapted from the Energy Resources lecture materials of Jane Woodward, Consulting Associate Professor of Civil and Environmental Engineering and Karl Knapp, Lecturer of Civil and Environmental Engineering at Stanford University by Cheryl Chadwick/Gregory Möller)
(Image credit: Siemens AG)
