Introduction
Stormwater treatment wetland Liupanshui. Photo: courtesy of Kongjian Yu
Does stormwater require treatment to improve its quality? If so, is the motivation environmental or human? From the presentation below you will learn about the contaminants present in stormwater and the capacity of treatment landscapes to remove them. You will learn that there are measurable ecosystem and human health benefits.
There are other sources of pollution in the urban environment associated directly and indirectly with people. Kitchen, toilet and other waste generated in homes and businesses is usually piped to wastewater treatment plants that apply large quantities of energy and chemicals to remove some of the contaminants. However, you will learn that biological treatment of domestic sewage is very effective and provides additional environmental and cultural benefits. As with stormwater, before we can devise effective treatment landscapes, we need to know the type and concentrations of the contaminants present. Our understanding of these topics comes from environmental engineering research and may challenge your understanding of chemistry and biology. Therefore, the presentation below defines fundamental concepts and processes. If you study these carefully, they will serve you later as you make landscape design decisions intended to create highly functioning landscapes.
Units
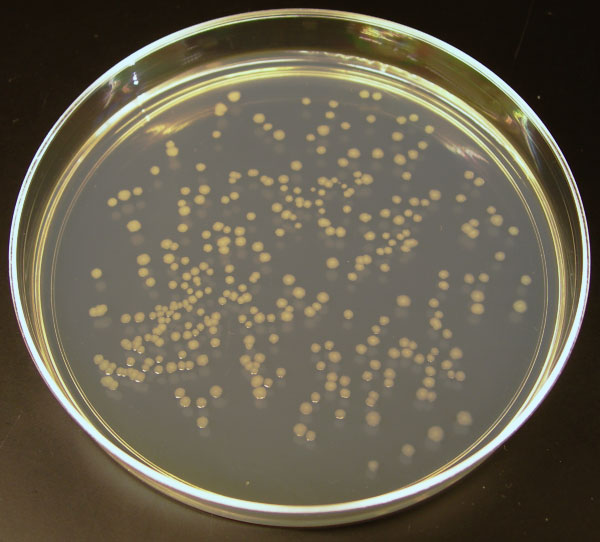
E. coli bacteria colonies in a culture dish. 126 colonies per 100mL of water is the primary contact maximum set by the EPA. Photo: Madprime, license cc-by-sa 3.0
Pollutants in water are measured in two ways. The concentration of contaminants is generally expressed as milligrams present within one liter (about a quart). There are 1000 milligrams per gram and about 28 grams per ounce. For example, the US Environmental Protection Agency (EPA) standard for total suspended solids in secondary sewage effluent is less than 30 mg/L. Extremely low concentrations are expressed in micro-grams per liter. Heavy metal concentrations in water are defined this way. For example, stormwater from landscaping contains about 263 micro-grams of zinc per liter.
The second way that pollutants are expressed is as a weight (often called the pollutant load). This is simply calculated as the mg/L times the total volume of water. In this way we can define the total pounds of phosphorous entering a river, for example. The EPA has a program that limits the pollutant load permitted for compromised or sensitive water bodies. The Total Maximum Daily Load (TMDL) is an example of a pollutant standard based on the total weight of the contaminant.
Bacteria in water is defined as the number of colonies that form in culture dishes containing a water sample. The number of colonies grow from a sample of 100 milliliters (about 3.3 ounces) of water. For example, E. coli is a disease causing bacteria and the EPA establishes a maximum of 126 colonies per 100 mL for water that is used for swimming.
The amount of exposure to pollution is sometimes distinguished as acute and chronic. Both are harmful, but the first is short-term (hours) exposure while the latter is long-term (several hours of days).
Stormwater Characteristics
Stormwater runoff is the most important contributor to the pollution of streams, rivers, lakes and coastal waters in the US. Stormwater runoff from areas modified from their natural conditions is polluted by waste from various human activities. Research studies provide us with an understanding of the land uses that typically contribute high concentrations of particular contaminants (Table 1).
Table 1. Stormwater runoff pollution concentration and land uses making the greatest contributions
Contaminant |
TSS a |
E. coli b |
TN a |
P a |
Copper c |
Lead c |
Zinc c |
Land-use |
|
|
|
|
|
|
|
Lawns |
602 |
|
9.1 |
2.1 |
|
|
|
Commercial Streets |
468 |
|
|
|
|
|
|
Auto Recyclers |
335 |
|
|
|
103 |
182 |
520 |
Industrial Parking |
228 |
|
|
|
|
|
|
Landscaping |
|
94,000 |
|
|
94 |
182 |
263 |
Residential Streets |
|
37, 000 |
|
0.55 |
|
|
|
Driveways |
|
|
2.1 |
0.56 |
|
|
|
Urban Highways |
|
|
3 |
0.32 |
54 |
400 |
329 |
Rural Highways |
|
|
22 |
|
|
|
|
Industrial Roofs |
|
|
|
|
62 |
43 |
1390 |
Heavy Industrial Land |
|
|
|
|
148 |
290 |
1600 |
Water Quality Standard |
30 |
126 |
|
0.05 |
13 |
65 |
120 |
Stream Background |
|
|
1 |
0.1 |
|
|
|
Kadlec, 2009. a = mg/L, b = colony forming units per 100 mL, c = micro grams. TSS = total suspended solids, TN = Total Nitrogen, P = Phosphorus
Species of pathogenic bacteria, in addition to E. coli, noted in Table 1, are also present in high concentrations in storm runoff. Fecal coliform, total coliform and E. coli bacteria are highly correlated with one another and with turbidity and suspended solids concentrations (Peters, 2009). Most of the concentrations of nutrients, bacteria and metals shown in Table 1 are far above U. S. Environmental Protection Agency standards. Total nitrogen listed in Table 1 includes organic nitrogen, ammonium, nitrite and nitrate. While there are no water quality standards for total nitrogen, concentrations of .2 mg/L for nitrite and 1 mg/L for nitrate are generally accepted maximums (Li, 2009).
Naturally Occuring Backgound Levels of Nutrients
| Nutrient | Background concentration (mg/L) |
| Total nitrogen in streams [Data from 28 watersheds] | 1.0 |
| Nitrate in streams | 0.6 |
| Ammonia in streams | 0.1 |
| Nitrate in shallow ground water | 2.0 |
| Total phosphorus in streams | 0.1 |
| Orthophosphate in shallow ground water [Data from 47 wells] | 0.02 |
Heavy Metals
Sources of Heavy Metals from Transportation |
|||||||||
| Source | Cd | Co | Cr | Cu | Fe | Mn | Ni | Pb | Zn |
Gasoline |
• | • | • | • | |||||
| Exhaust | • | • | |||||||
| Motor Oil & Grease | • | • | • | • | • | ||||
| Antifreeze | • | • | |||||||
| Undercoating | • | • | |||||||
| Brake Linings | • | • | • | • | • | ||||
| Rubber | • | • | • | • | |||||
| Asphalt | • | • | • | ||||||
| Concrete | • | • | • | ||||||
| Diesel Oil | • | ||||||||
| Engine Wear | • | • | • | • | • | ||||
Cadmium (Cd), copper (Cu), iron (Fe), manganese (Mn), nickel (Ni), lead (Pb), zinc (Zn). Source: Local Ordinances: A Users Guide, Terrene Institute and EPA, Region 5, 1995. |
|||||||||
Parking Lot Contaminants
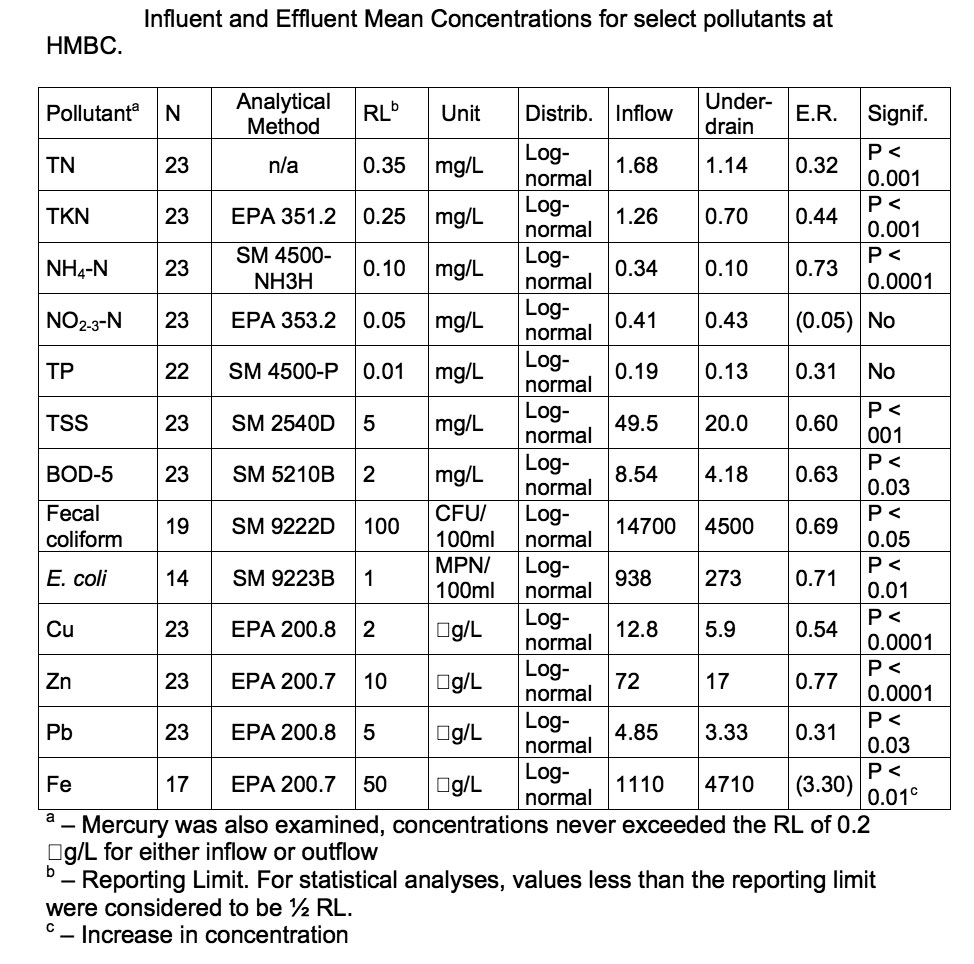
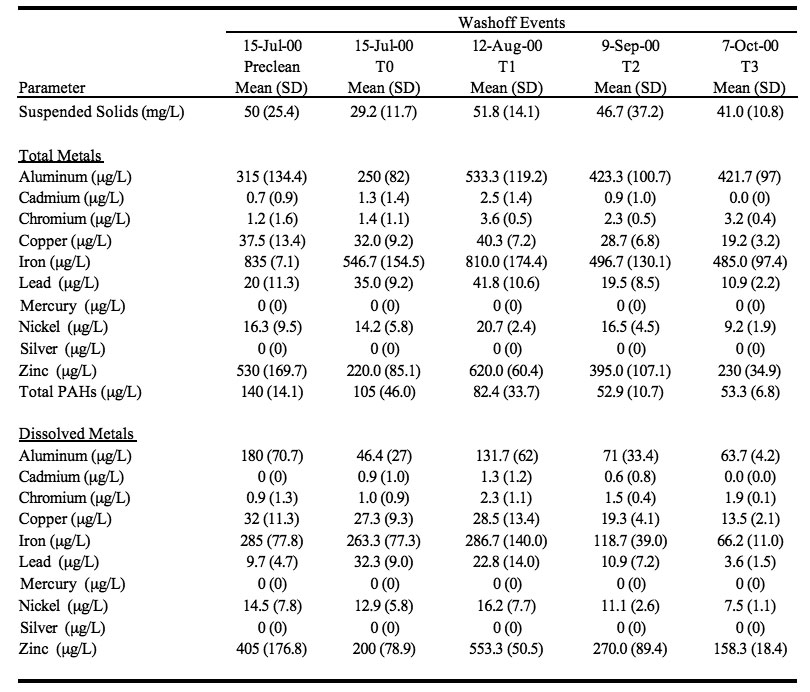
Left: Hal Marshall Wetland, Hunt, 2007. Right: Parking Lot contaminants, Tiefenthaler, 2001
In this tutorial we are interested in gaining an understanding of the pollution levels associated with different use of the landscape. We will use this information as the expected existing condition when, later in the semester, we propose treatment landscapes. Therefore, study the table, above left, for the the pollution levels since the catchment is an asphalt parking lot. We can compare these to other research that characterizes stormwater pollution and use the information as the anticipated level of pollution.
Copper (Cu), lead (Pb), zinc (Zn) and Iron (Fe) are the heavy metals reported in the table. Their concentration is expressed in mircograms per liter.
There are also four nitrogen forms considered:
- TN -total nitrogen
- TKN - This is k nitrogen which measures a combination of organic nitrogen, ammonia, nitrite and nitrate
- NH4 - Ammonium (un-ionized ammonia)
- NO2, 3 - Nitrite and nitrate
Total phosphorus (TP) like nitrogen is a troublesome nutrient when in excess in the aquatic ecosystem.
The table shows an indirect measurement of pathogenic bacteria (fecal coliform) and a more direct indicator (E. coli).
The second table, above right, reports the contaminants from parking lots in Southern California. The lots were entirely paved with asphalt and sloped at 4%. One of the lots was heavily used while the other was more lightly used. Five applications of "artificial rain" were applied and the stormwater runoff was collected and the pollutants were measured. The metals Zn, Pb and Cu in the dissolved phase accounted for 65% to 81% of concentrations in surface runoff samples. Mean total PAH (polycyclic aromatic hydrocarbons) concentrations in surface runoff samples ranged from 0.08 to 180 µg/L. Parking lot usage and maintenance (one lot was swept visible sediment with brooms, or a leaf blower into the path of a power vacuum truck) did not affect the accumulation of runoff constituents. Parking lot runoff samples collected during the first 10 minutes of a rain event contained the highest constituent concentrations, indicative of a first-flush event. Since the stormwater runs off in to a bay the toxicity of the runoff was tested using sea urchins, a marine shrimp and a marine bacteria. The runoff was toxic to these organism. Zinc concentration was probably most responsible for the toxicity.
We will review this table again later, when we consider the performance of bioretention basins.
Highway Contaminants
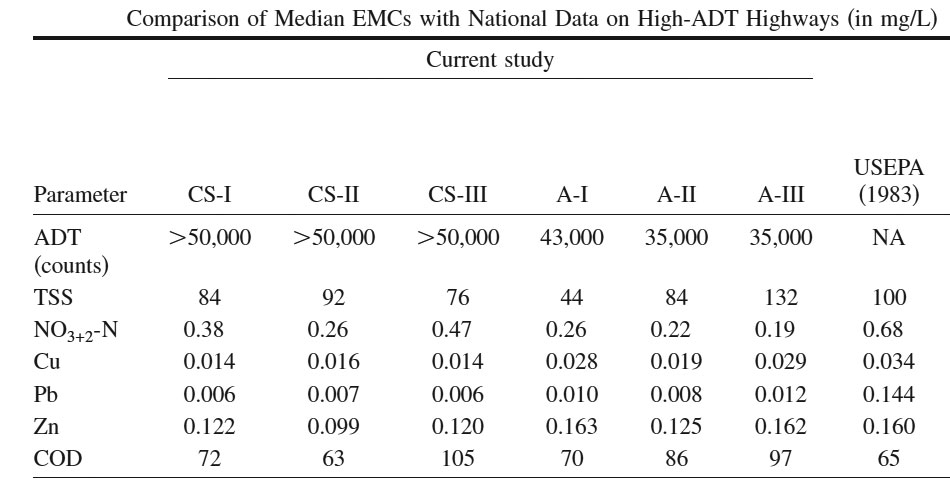
Stormwater pollution from highway runoff. Li, 2008.
The runoff from highways is somewhat different from parking area pollution levels. The table above shows the level of pollutants from a Texas highway study as well as EPA data. Use this research data as the estimate of pollution levels from streets if you will treat this stormwater on-site.
Pesticides

Interior
There are many pesticides used in the agriculture and residential sectors. You can imagine that these could be problematic when developing a biological treatment system.
Six Pesticides Found Frequently in Stormwater Samples |
|
Pesticide Name |
Human Health and/or Environmental Effects |
2,4-D |
Associated with lymphoma in humans; testicular toxicant in animals. |
Chlorpyrifos |
Moderately toxic to humans; neurotoxicant; can be highly toxic to birds, aquatic organisms, and wildlife. |
Diazinon |
Moderately toxic to humans; neurotoxicant; can be highly toxic to birds, aquatic organisms, and wildlife. |
Dicamba |
Neurotoxicant; reproductive toxicity in animals; association with lymphoma in some human studies. |
MCPA (Methoxane) |
Low toxicity to non-toxic in test animals, birds, and fish; suspected gastrointestinal, liver, and kidney toxicant. |
MCPP (Mecoprop) |
Slightly to moderately toxic; some reproductive effects in dogs; suspected cardiovascular, blood, gastrointestinal, liver, kidney, and neurotoxicant. |
Sources: T.R. Schueler. Urban Pesticides: From the Lawn to the Stream,quot; Watershed Protection Techniques, vol. 2, no. 1, Fall 1995, pp. 247, 250 and Extoxnet: Extension Toxicology Network Pesticide Information Profiles, http://ace/orst.edu/info/extoxnet, and Environmental Defense Fund, Scorecard Chemical Profiles, http://www.scorecard.org/chemical-profiles. |
|
Stormwater Contamination of Streams
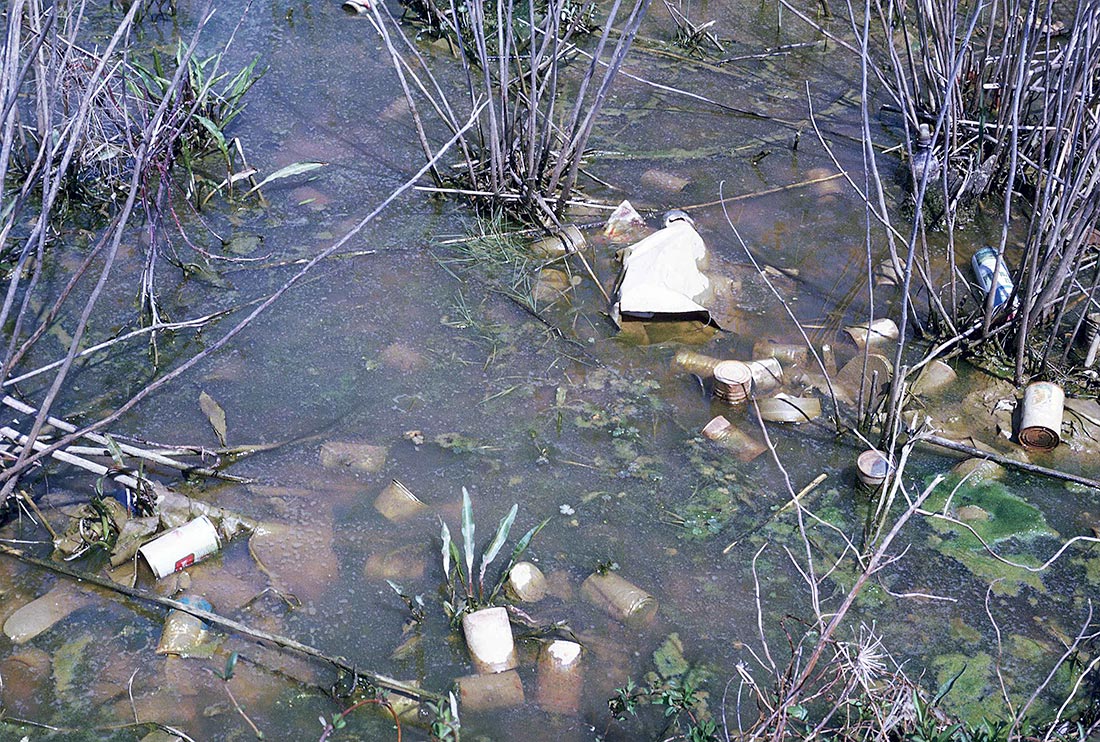
Non-point source pollution. Photo: Luther Goldman, USFWS, license public domain.
It seems clear that the pollution levels indicated above would degrade stream water quality. Water quality does diminish as urban and other human uses change watersheds from their natural state. In 2003, the city of Atlanta, Georgia developed a stream water quality monitoring network that annually gathered data from 21 stations. From 2003 to 2007 data was collected for more than 20 stream watersheds. The degree of watershed urbanization ranged from 69 to 93%. The data from urban watersheds was compared to a small forest watershed and a larger, lightly developed watershed as references (Peters, 2009).
The study indicates that urbanization impacts stream water quality but this impact is highly variable. Increased alkalinity and concentrations of calcium and magnesium in urban streams were thought to be associated with the weathering of concrete. High levels of chlorine were associated with combined storm and wastewater sewer outflow treated with sodium hypochlorite as well as drainage from swimming pools and road deicing salts (CaCl2). The fecal coliform bacteria levels exceeded the EPA standard for primary or secondary use in more than 90% of the test samples taken from urban watershed streams. Nutrient levels in streams were high compared to streams in natural areas but lower than EPA standards.
The first flush of impervious surfaces resulted in high concentrations of copper, lead and zinc. Copper and zinc in most of the streams exceeded Georgia’s chronic and acute standards (chronic levels damage aquatic organisms when exposure exceeds 4 days, acute levels damage aquatic organisms when exposure exceeds 1 hour). Lead was detected at chronic levels. These metals are common in highway runoff and industrial land use. Vehicle tire particles and decayed metal fittings used in building construction are the common sources of these metals. Cadmium exceeded state standards only in a small percentage of tests.
Study Questions
What is the EPA standard for total suspended solids in secondary sewage effluent?
What units are used to characterize the concentration of heavy metals in stormwater?
What does the abbreviation TMDL stand for?
What is the maximum number of colonies of E. coli within a 100 mL sample of water for rivers, lakes and coastal waters used for swimming (primary contact)?
According to Table 1 which land-use typically contribute the most total suspended solids (TSS) to stormwater?
According to Table 1 which land-use typically contribute the most Total Nitrogen (TN) to stormwater?
According to Table 1 which land-use typically contribute the most Phosphorus (P) to stormwater?
According to Table 1 which land-use typically contribute the most E. coli to stormwater?
True/False E. coli is the only bacteria species that is of concern in stormwater.
In the study of watershed streams near Atlanta GA, at which level (below detection, below regulatory standard, acute, or chronic) were copper, lead and zinc?
What percentage of the test samples in the Atlanta GA watershed stream study were found to exceed the standard for primary and secondary recreational contact?
References
- Kadlec, R. H; Wallace, S. 2009. Treatment Wetlands. 2nd edition. CRC Press, Boca Raton, FL.
- Peters, Norman. 2009."Effects of Urbanization on Stream Water Quality in the City of Atlanta Georgia, USA". Hydrological Processes. 23:2860–2878.
- Li, H; Davis, A. 2009. “Water Quality Improvement Through Reductions of Pollutant Loads Using Bioretention.” Journal of Environmental Engineering. August 2009.
- Natural Resources Defense Council. www.nrdc.org/water/pollution/storm/chap2.asp
- L. Tiefenthaler, K. Schiff, and S. Bay, “Characteristics of parking lot runoff,” Southern California Coastal Water Research Project, Long Beach, California, SCCWRP Technical Report #343, 2001.
- M.-H. Li, M. E. Barrett, P. Rammohan, F. Olivera, and H. C. Landphair, “Documenting Stormwater Quality on Texas Highways and Adjacent Vegetated Roadsides,” J. Environ. Eng., vol. 134, no. 1, pp. 48–59, Jan. 2008.