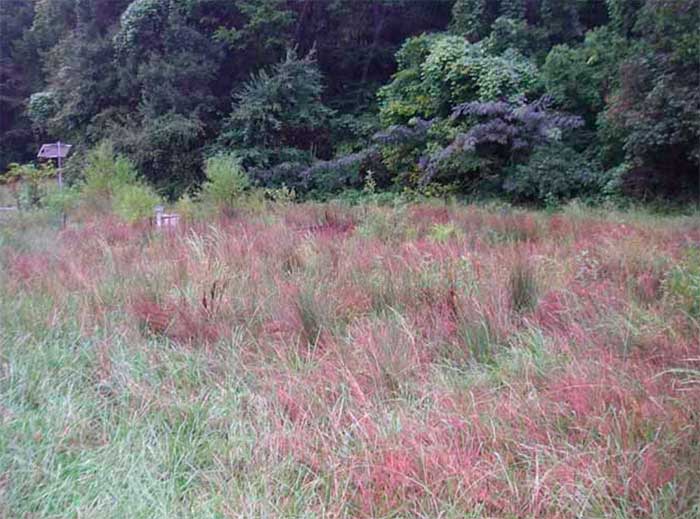
Free Surface Water Constructed Wetlands
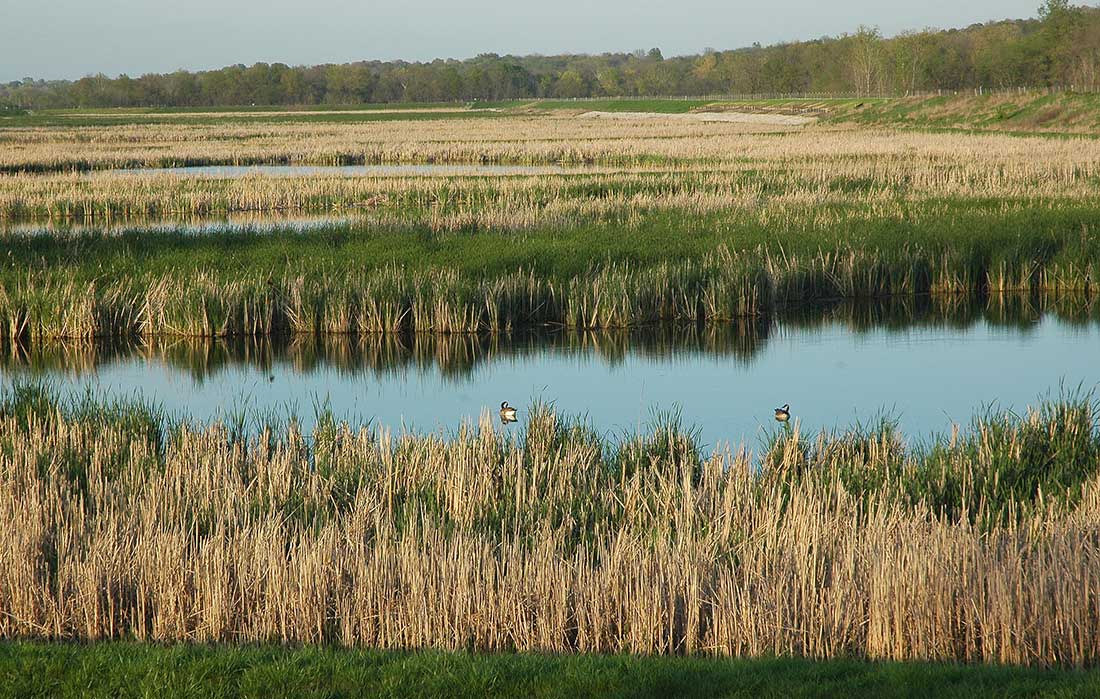
FWS wetland near Columbia Missouri. Photo: Austin, 2012.
The FWS wetland is a series of heavily planted marsh beds, 12”-30” deep. Sometimes open water cells 3’– 6’ deep are incorporated. As water flows through the vegetation, solids settle and bacteria growing on the plant stems and the soil surface consume organic material and reduce nutrient concentrations. One of the most important factors leading to high wetland performance is good pretreatment to remove some of the suspended solids and evenly distributed flow through the wetland. The tendency for water to establish preferred flow paths through the wetland is thwarted by redistribution of water in several cells arranged in a series.
The image above shows a large FWS wetland used to treat water that has already met secondary treatment standards at a conventional wastewater treatment plant. Therefore, the wetlands are intended to achieve tertiary standards. Nitrogen, phosphorus and temperature are the most common problems that the FWS wetlands are designed to dress. FWS wetlands can not be used for secondary treatment of wastewater where the public has access, however, once pathogenic bacterial levels meet recreational contact standard, then these wetlands can be part of the public landscape.
Plan Elements
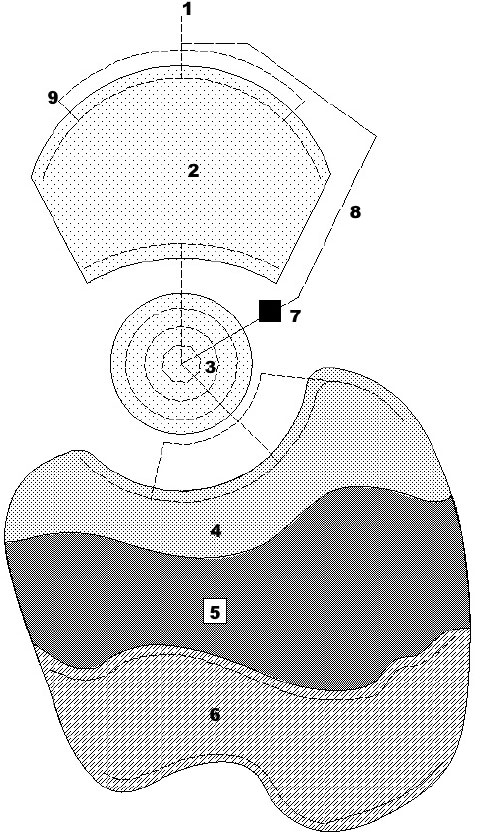
Hybrid Wetland. 1 – Inlet from septic tank or lagoon; 2 – Horizontal subsurface flow wetland; 3 – Vertical subsurface flow wetland; 4 – Deep marsh (18” deep); 5 – Open water (4’ deep); 6 – Shallow marsh (12” deep); 7 – Optional pump; 8 – Pipe to return 50% of water from VSF to HSF wetland for de-nitrification; 9 – Distribution, inlet and outlet pipes. All zones are densely planted except for the open water zone. Austin, 2009.
The plan above shows a hybrid wetland where HSSF, VSSF and FWS wetlands are used in a sequence. The FWS wetland is located at the bottom of the image.
The design in the plan shown above calls for distribution pipes (#9), a deep marsh cell (#4), a deep water section (#5), a shallow marsh (#6), and collection pipes to ensure uniform distribution a the beginning of each cell.
During secondary treatment, if the FWS wetland is the first or only stage in the treatment sequence, then public access, and perhaps animal access, to the water in the FWS wetland must be prohibited due to the elevated levels of pathogens or other contaminants present.
In severe winter areas of northern US and southern Canada the size of a FWS wetland may need to double to achieve the required BOD and TSS standards during winter. Monitoring of existing wetlands has established a sizing rule of 54 to 48 square feet (5-4.5 m2) per person for FWS or HSSF wetlands to accomplish secondary treatment standards for domestic wastewater (Cooper, 2009). This equals about one acre for every 850 people the system serves. For accurate wetland sizing, matched to target contaminants or nutrient reduction, communities should consult an environmental engineer, but the sizing rule above allows landscape architects to locate and size systems for planning and design studies.
If the wetland is not used to treat domestic wastewater to secondary standards then the sizing rule above doesn't apply. When treating stormwater or water already meeting secondary standards then the size of the wetland can be estimated based on the mass loading rates of various constituents, as shown in the table below. For example, if the anticipated daily inflow is 100 cubic meters this equals 100,000 liters. If the influent concentration of BOD is 50 mg/L then 50x100,000= 5,000,000 milligrams of BOD. 5 million milligrams equals 11 pounds. Therefore, a one acre wetland is indicated according to the table below. The table allows the wetland to be sized for the constituent of greatest concern. Work through your own example using nitrate as the constituent and the table below (note: there are 453,592 mg per pound).
Sizing FWS Wetlands Using Mass Loading Rates
Constituent |
Mass Loading Rate Lb/acre/day |
BOD |
9-89 |
TSS |
9-100 |
Total Nitrogen |
2-9 |
Ammonia |
1-4 |
Nitrate |
2-9 |
Total Phosphorous |
1-4 |
Performance of Built Free Water Surface Wetlands
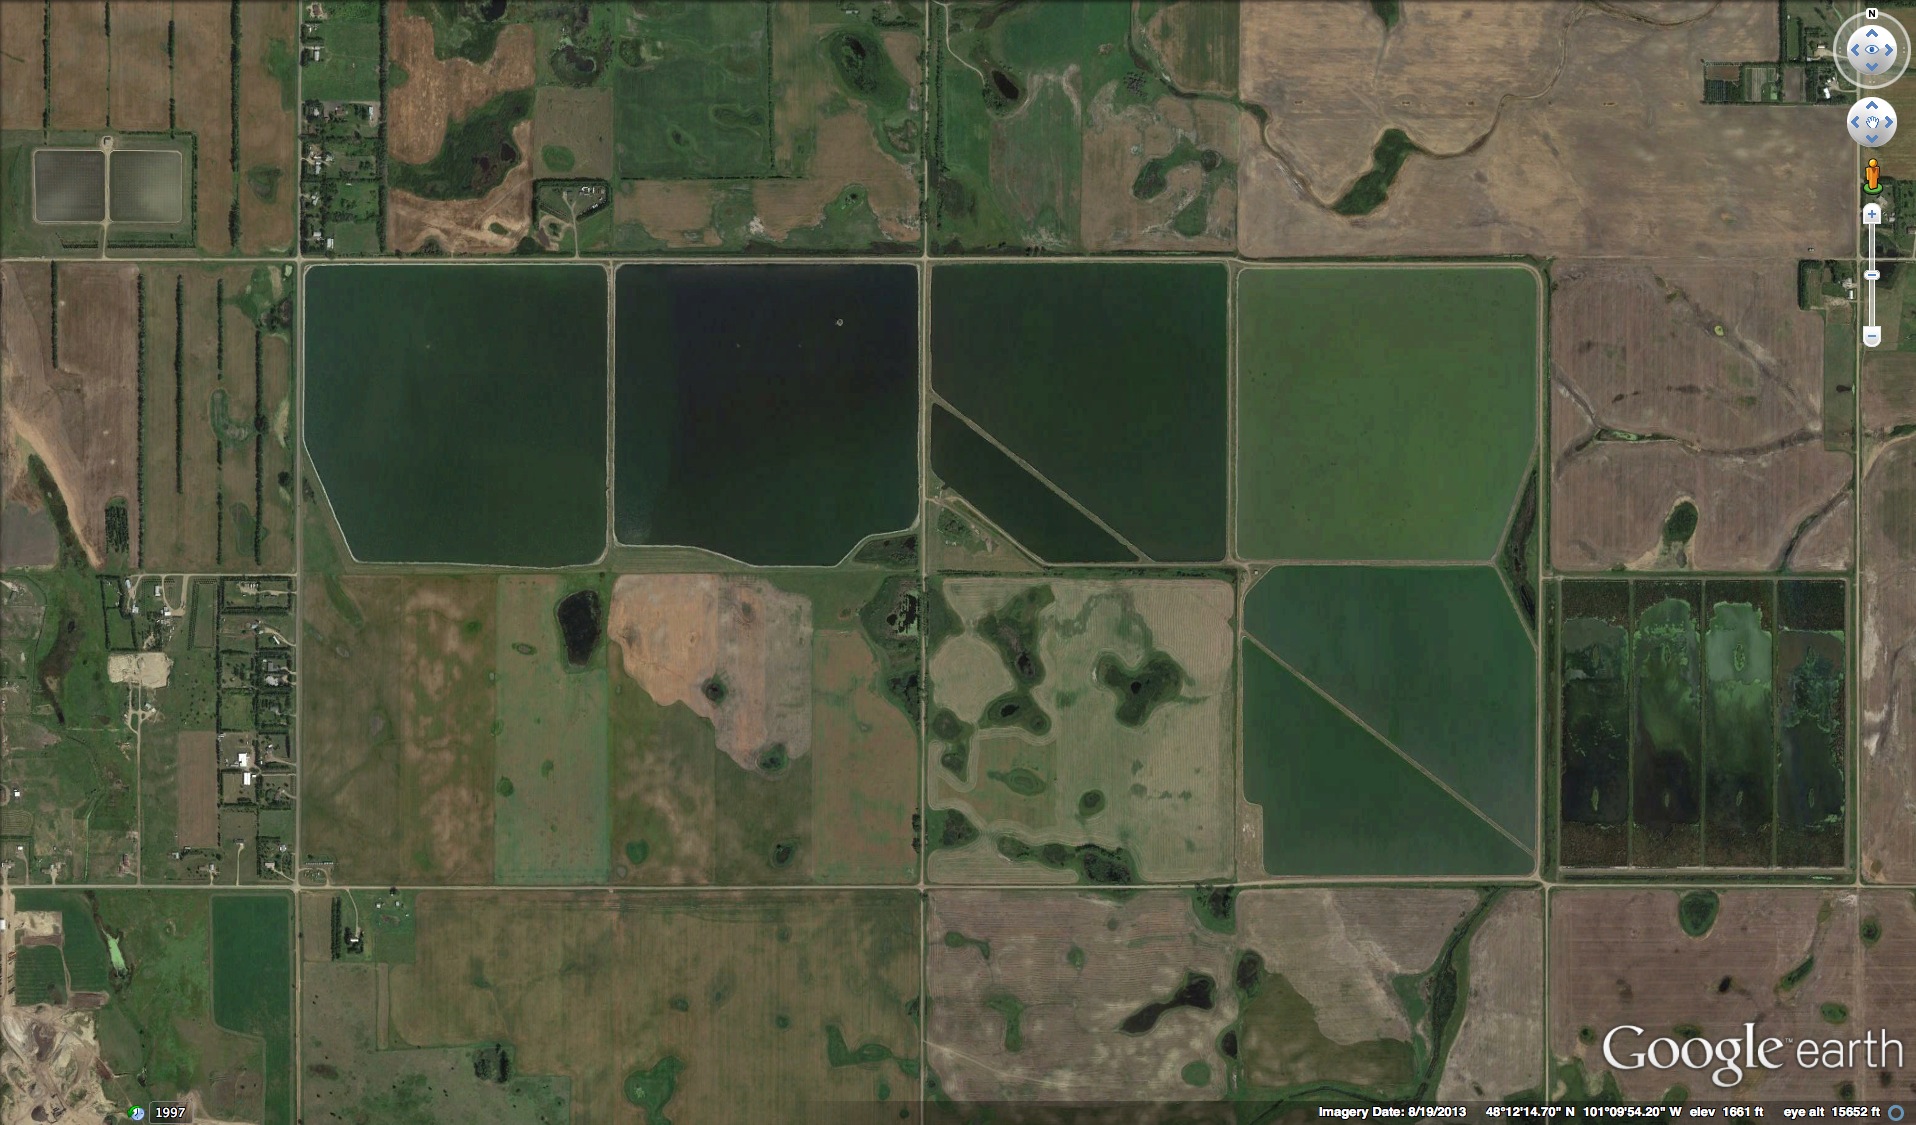
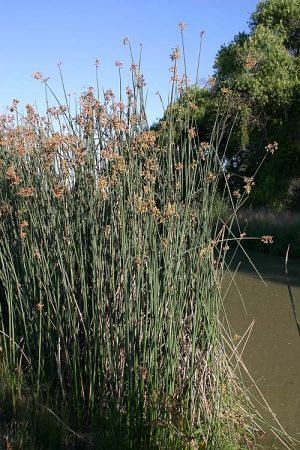
Left: Minot wetlands 8/19/2013 Google EArth48°12'14.70" N 101°09'54.20" W accessed 2/20/2014. Right: Hardstem Bulrush (S. acutus). Photo: Stephen Laymon, Bureau of Land Management, license government work, public domain.
The following two examples of built free water surface wetlands demonstrate their effectiveness and typical use in the U. S. An example of a FWS constructed wetland as the third stage of a biological wastewater treatment system is the wetland in Cle Elum, Washington constructed to serve 2,300 people. The system included two facultative sewage lagoons, instead of septic tanks, followed by a 5-acre FWS constructed wetland divided into three sections by two 3’ deep, open water trenches. The marsh sections were planted with Bulrush (Scripus acutus, above right) and represented 68% of the wetland area. The deep-water strips discouraged short circuit flows by redistributing water evenly across the width of the wetland. Performance of the system for BOD and TSS was outstanding. Influent BOD (182 mg/L at the lagoon inlet) was reduced 96% to 6.4 mg/L. Influent TSS (169 mg/L at the lagoon inlet) were reduced 98% to 3 mg/L at the wetland outflow. The level of dissolved oxygen at the constructed wetland outfall averaged 6.9 mg/L compared to minimum levels of 0.2-0.6 mg/L required for conversion of organic matter to ammonium and the conversion of ammonium to nitrate (Zhang, 2010).
A large FWS constructed wetland in Minot, North Dakota (above left) included a four cell 126 acre (51.2 ha) marsh > pond > marsh system. Like at Cle Elum, water pretreatment occurred in facultative lagoons. The wetland was created to meet an effluent level of 1 mg/L for nitrate. Wetland influent was 12.7 mg/L, 39.7 mg/L, and 2 mg/L for BOD, TSS and nitrate, respectively. Effluent concentrations and removal percentages were: BOD - 7.3 mg/L, 42.6%; TSS - 19 mg/L, 52.2% and nitrate - .06 mg/L, 69.4% (Hammer, 2002). The US EPA drinking water standard for nitrate is 10 mg/L (EPA, 2009). This example illustrates the effectiveness of FWS constructed wetlands for both secondary treatment but also advanced treatment for the removal of ammonium and nitrates. Performance in the coldest weather was less effective, especially for nitrate removal.
Background Levels and General Performance
Left: This lushly vegetated FWS wetland in in Silverton Oregon and treats water from the city wastewater treatment plant to meet advanced standards. In addition this wetland is a feature of the Oregon Gardens, a display garden and tourist attraction. Photo: Austin.
There is a water quality improvement limit for FWS wetlands used to treat wastewater or stormwater. The table below shows the levels of nutrients and coliform bacteria expected in unpolluted natural wetlands. Notice that the BOD (6.4 mg/L) and TSS (3 mg/L) levels for the Cle Elum FWS wetland discussed above are well within the background levels noted in the table below. The nitrate level (.06 mg/L) in the Minot wetland is slightly above the natural background level.
Constituent |
Background Level |
BOD |
1-10 mg/L |
TSS |
1-6 mg/L |
Total Nitrogen |
1-3 mg/L |
Ammonia |
<0.1 mg/L |
Nitrate |
<0.1 mg/L |
Total Phosphorous |
<0.2 mg/L |
Fecal Coliforms |
50-500 #/100mL |
The performance of 27 FWS wetlands is summarized below. The influent concentrations are low reflecting the use of FWS wetlands as stormwater or tertiary wastewater treatment systems. This data is a little dated and may not represent typical performance of wetlands constructed based on the most recent methods. EPA 2000.
Constituent |
Mean Influent mg/L |
Mean Influent mg/L |
Background Level mg/L |
BOD |
70 |
15 |
1-10 |
TSS |
15 |
1-6 |
1-6 |
Total Nitrogen |
12 |
4 |
1-3 |
Ammonia |
9 |
7 |
<0.1 |
Nitrate |
3 |
1 |
<0.1 |
Total Phosphorous |
4 |
2 |
<0.2 |
Fecal Coliforms |
73,000 |
1,320 |
50-500 |
Performance of FWS Compared to Other Constructed Wetland Types
![]()
![]()
The tables above compare the performance of the FWS wetland with the other types. Left: Performance for BOD and TSS. Right: Performance for nitrogen and phosphorus.
Legend: Treatment efficiency (Eff, in %) of various types of Inflow (In) and outflow (Out) concentrations in mg/L. HLR = hydraulic loading rate (cm/d). N = number of constructed wetlands. Source: 2010.
You can see that the performance of the FWS wetlands have comparable performance when compared to other wetland types, especially when full strength wastewater is being treated. Ammonia removal is similar to the HSSF type but total nitrogen removal is comparable.
Stormwater Treatment
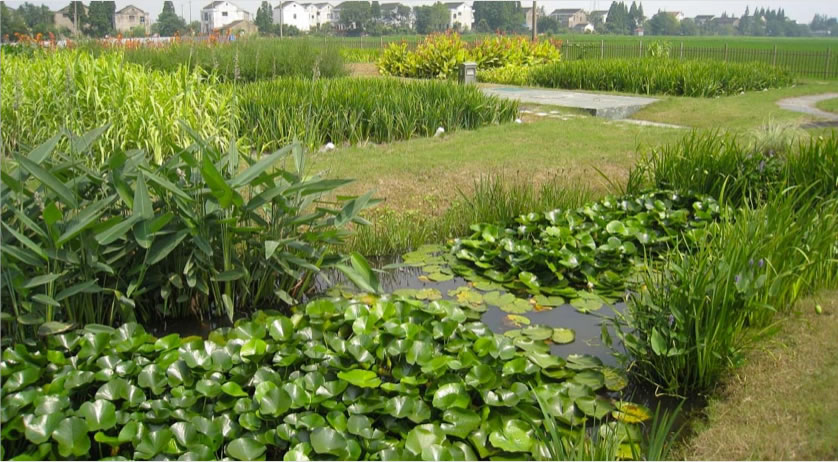
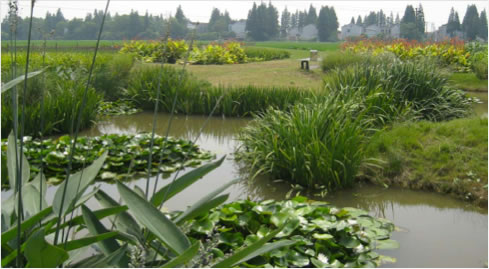
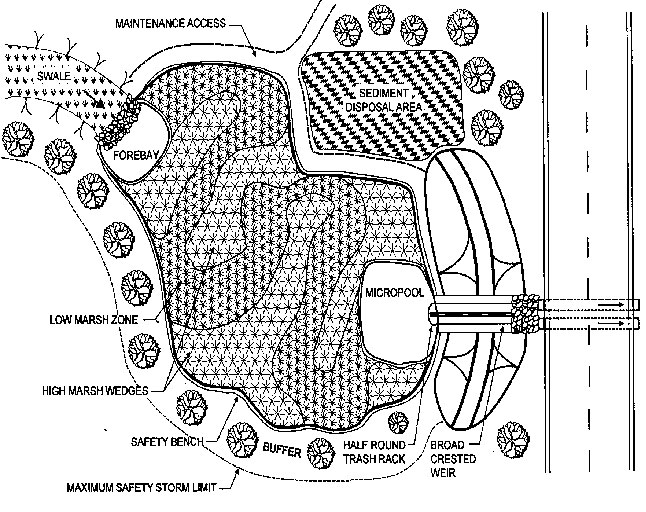
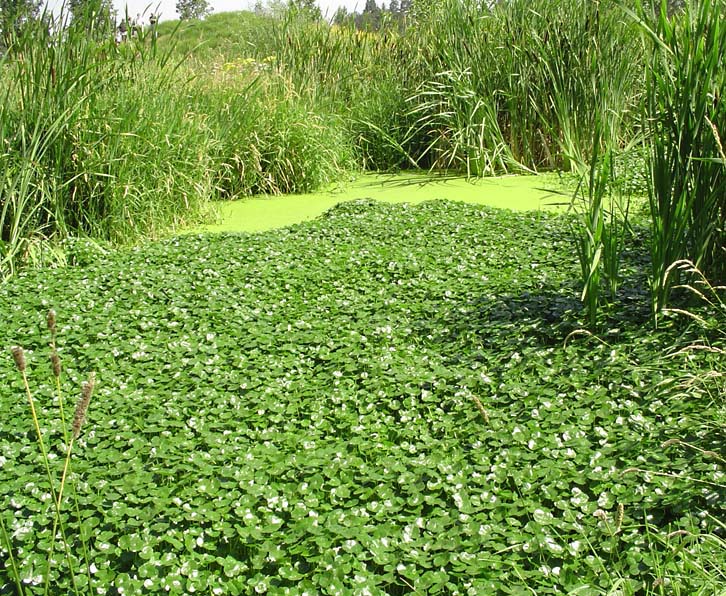
The stormwater wetlands in the first two images show the ornamental quality possible for either wastewater or stormwater wetlands. This project is in warm climate in China. Photo: Blumberg Engineers. Right: The design elements of a FWS wetland are presented in this plan view.
As in the Wilmington stormwater wetland, the plan above features deeper pools at the inlet and outlet and a low flow route through the basin. Storm flows are deep enough to flow across the low flow across the low and high marsh areas. Note that this plan does not include an initial or intermediate spreader to distribute the water evenly. This is a necessary element of larger wetlands. This plan includes a sediment disposal area to reduce maintenance cost. Access for a backhoe to the sediment pool whether it is inside for before the wetland is important. An outlet structure that retains the treatment volume, allows a low flow discharge and passes storms larger than the design storm is always required.
Dye Branch Stormwater Wetland
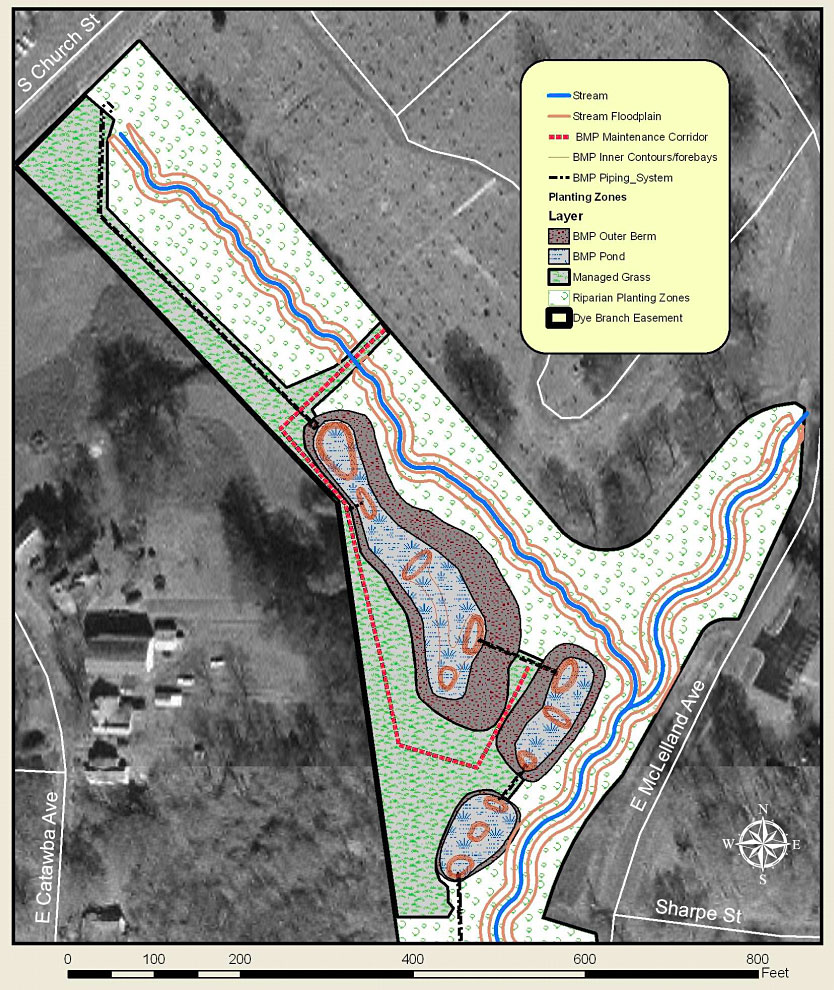
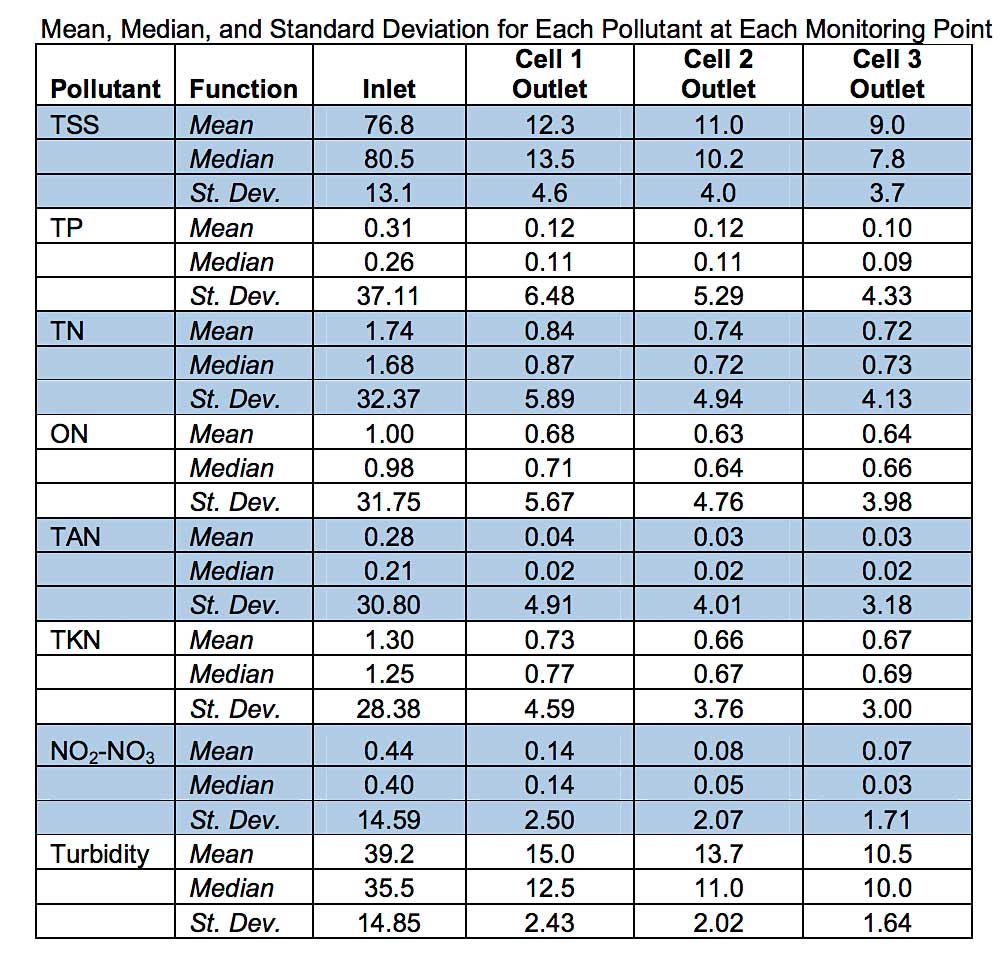
Left: plan showing the three cells of the stormwater wetland (Hathaway, 2009). Right: Water quality performance of the wetland cells (Hathaway, 2009). ON = organic nitrogen, TAN = total ammonia form of nitrogen, TKN = Total Kjeldahl Nitrogen (total organic nitrogen plus ammonia forms of nitrogen)
You know that FWS wetlands are quite effective for the treatment of stormwater from our review of the Wilmington MD wetland. Here is another example of a stormwater wetland with data to demonstrate its performance.
The Dye Branch Wetlands are in the North Carolina in the town of Mooresville, North Carolina. Constructed between the Fall of 2005 and the Spring of 2006, the catchment is 31 acres (60% impervious). The composite curve number (CN number) for the watershed is estimated to be 87.5. Soils in the watershed are primarily a fine sandy loam. The wetland cells have a combined area of 0.81 acres. Up to 4.7 cubic feet per second enters the wetland. At this rate about 0.2" inches per hour enter the wetland from the watershed. A diversion structure directs larger flows away from the wetland and serves as a sedimentation basin. A 1" water quality storm would comprise 50,000 cubic feet of water but the Dye Branch wetland can retain only 20,300 cubic feet due to space and topography limitations. Therefore, the wetland is undersized based on agency requirements.
The first wetland cell (upper left in the plan above) includes a 2,200 square foot sediment fore-bay. The next two cells are smaller. Enlarge the table above. It shows that most of the water quality improvement (about 80%) occurs in the first cell. Changing to another type of treatment strategy might have improved parameters not treated by a FWS wetland.
Dye Branch Stormwater Wetland
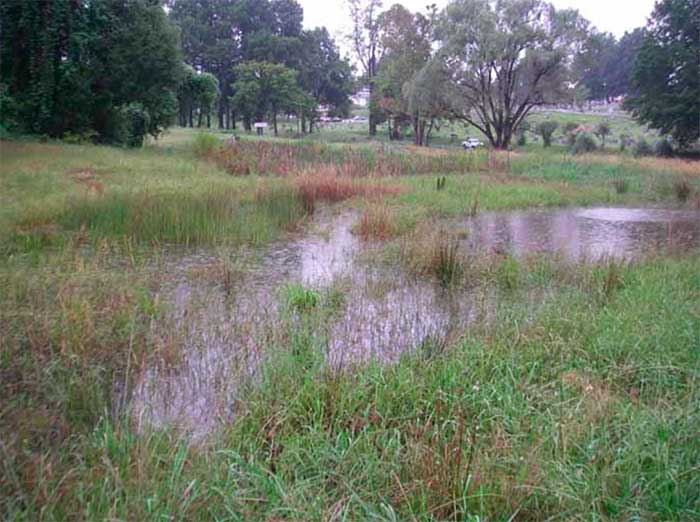
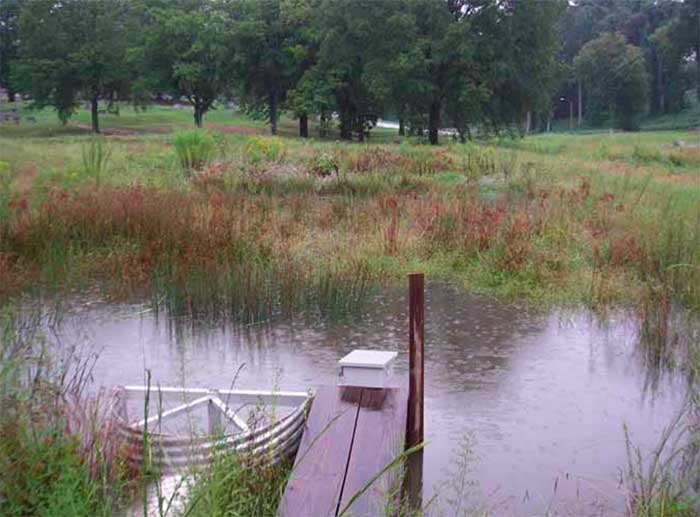
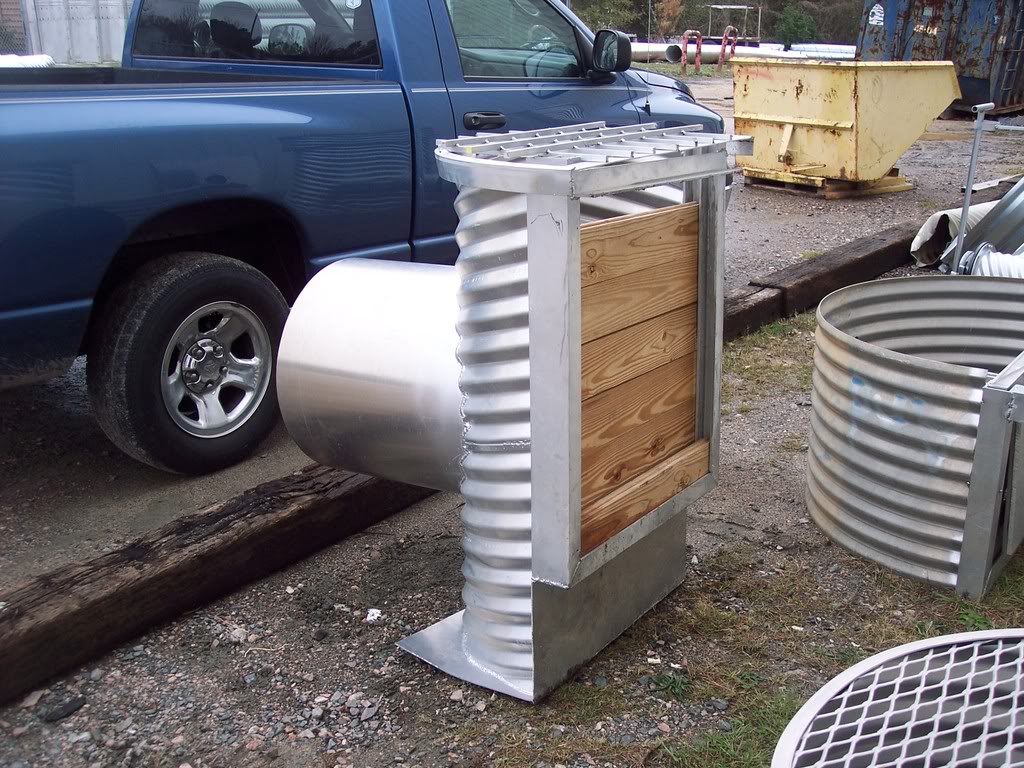
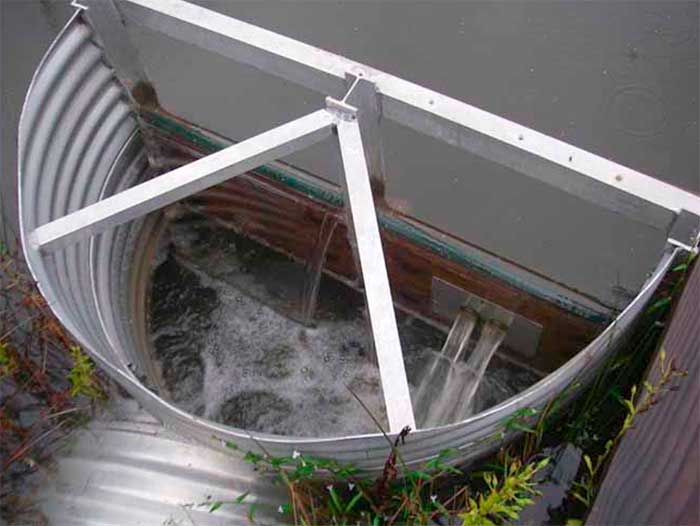
The first three images show the three wetland cells. The last two images show a free-board outlet device that controls the water depth in the wetland and passes storms larger that those capable of being held by the wetland. Photos: Jon Hathaway, 2009.
The images of the wetland cells are attractive and show the project during a heavy rain storm. The high permeability of the soil caused the permanent pools in the cells to drop below the anticipated permanent pool elevation. This contributed to more storm storage capacity than planned.
In the enlargement of the last image above you can see the two holes on the right side that deliver water between the cell to maintain the permanent pool levels. On the right you can see the weir that passes the large storm volumes.
Dye Branch Stormwater Wetland
These three images show construction stages of a stormwater wetland at Providence Estate, Greenvale, Victoria, Australia. Photos: Programmed Property Services.
The first image show the grading for the basin. The fabric that you can see, covers the wetland planting area. The fabric is called jute. Its natural and degradable. It prevents erosion, protects the new plants and reduces the soil temperature by blocking the sun, and reduces evaporation. Coconut fiber and straw blankets are also used for temporary erosion control and plant establishment. In the second image you can see about eight net supported by hoops to prevent damage of the seedlings by animals and birds. The last image show the completed project after a season of growth. Notice that the wetland is divided into three areas. The sedimentation pool, the zone with macrophytes and a berm and a outlet pool.
Improved Retention Basin Designs
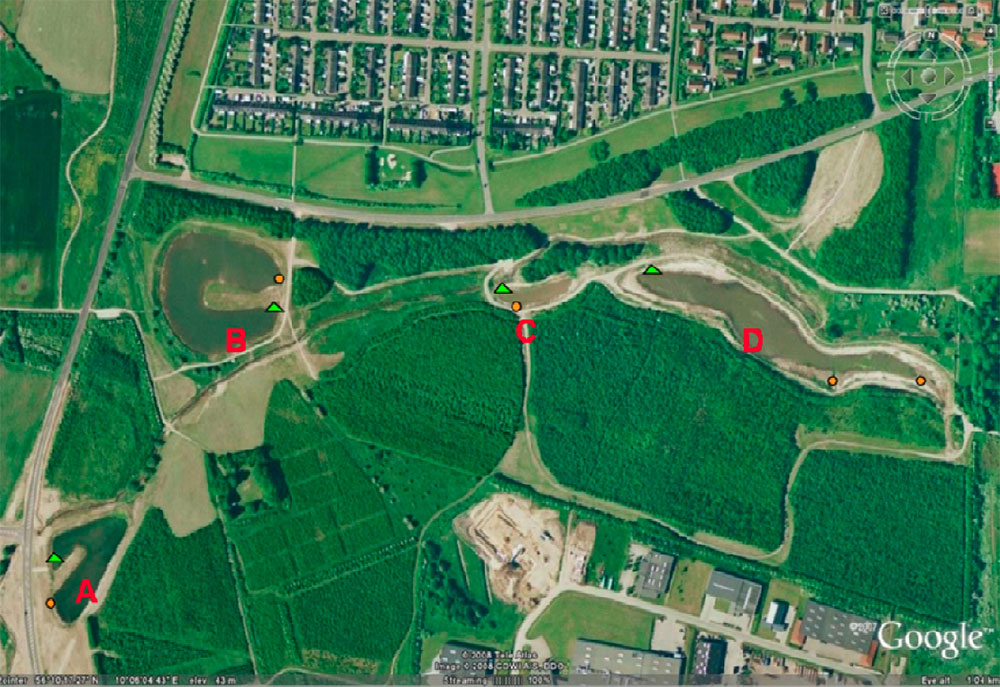
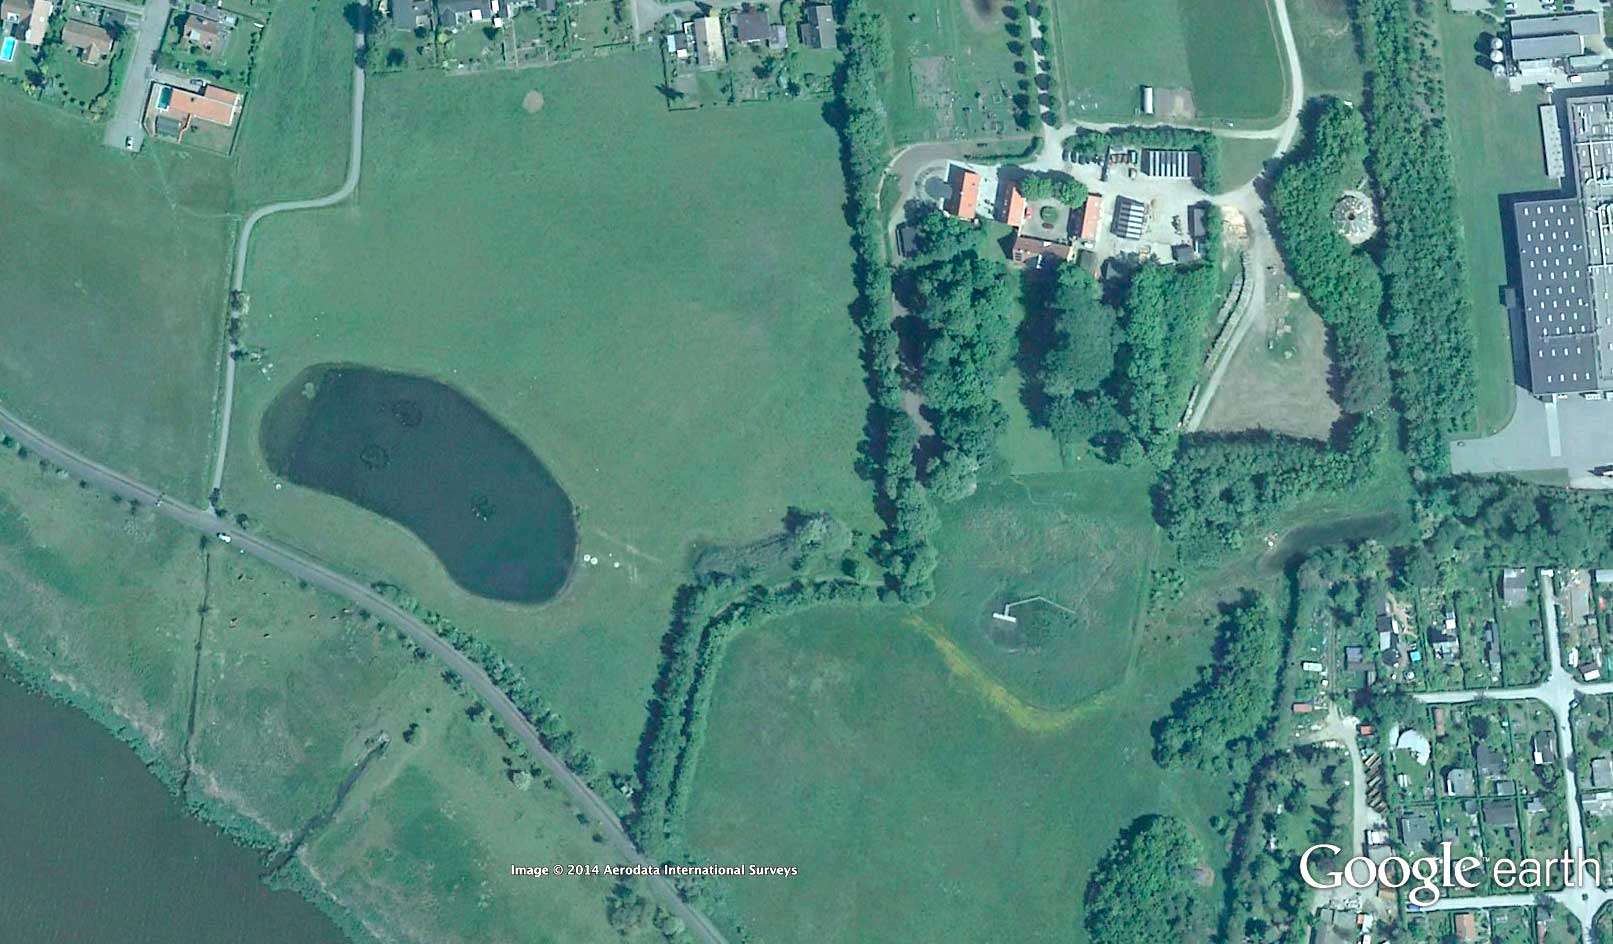
Left: Aerial image of existing retention basins in Aarhus. Center: showing a retention basin with a sand filter, also in Aarhus (56°08'42.81" N 10°08'17.02" E) from 2014. Right: Schematic section through the retention basin with sand filter. Images: Aerial images - 56°10'14.15" N 10°06'04.95" E, Google Earth. Section Istenič, 2012.
There are excellent opportunities for landscape architects to upgrade stormwater detention and retention basins. The treatment of a full range of runoff contaminants can be improved by adapting basins that have already been constructed and designing new basins that perform better. To illustrate the process and benefits of this conversion a project in Aarhus, Denmark is presented here. Aarhus is a city of 250,000 people that constructed 130 retention basins at the margin of the city to control stormwater runoff from a range of land-uses. These were originally unplanted but some natural colonization of wetland plants has occurred. In the first image above you can see a sequence of four retention ponds that are typical of the many already constructed. The orange dots indicate the inlet locations and the green triangles are the location of the pond outlets. Basins like these depend on sedimentation to trap pollutants. Therefore, their shape is more linear than HSSF wetlands, for example. However, some substances, including heavy metals, are present in a dissolved state (or particles that are so small that they remain suspended in water, colloidal) as well as settleable particles (Istenič, 2012).
In the center image above, a similar retention basin was constructed but this one features a planted sand filter just before the outlet structure. The basin can hold 196,000 cubic feet of runoff from 150 acres of multi-family residential use (45% impervious). The effluent is discharge into the lake that you can see in the lower left corner of the image.
Enhanced Design for a Retention Basin
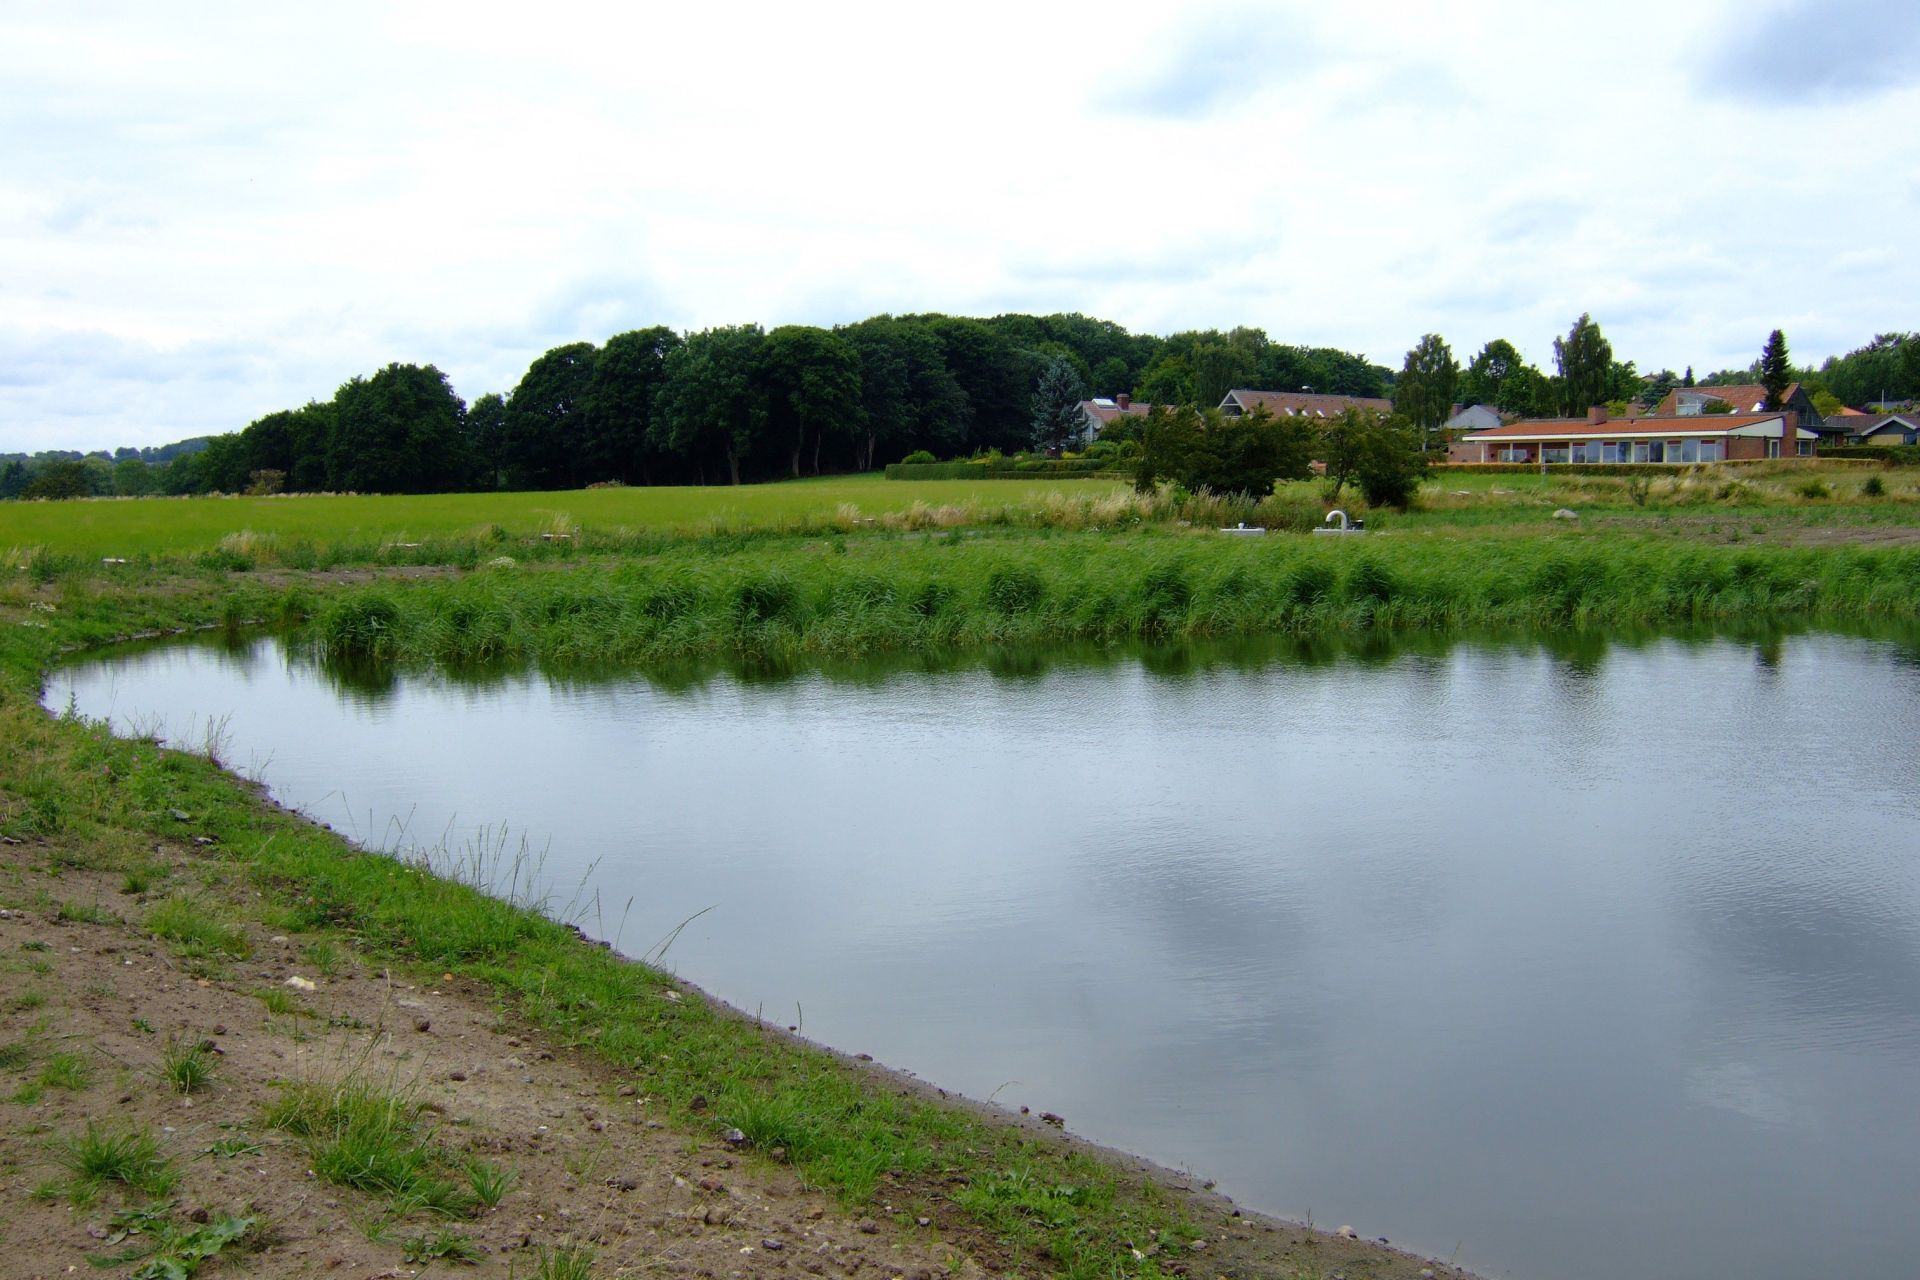
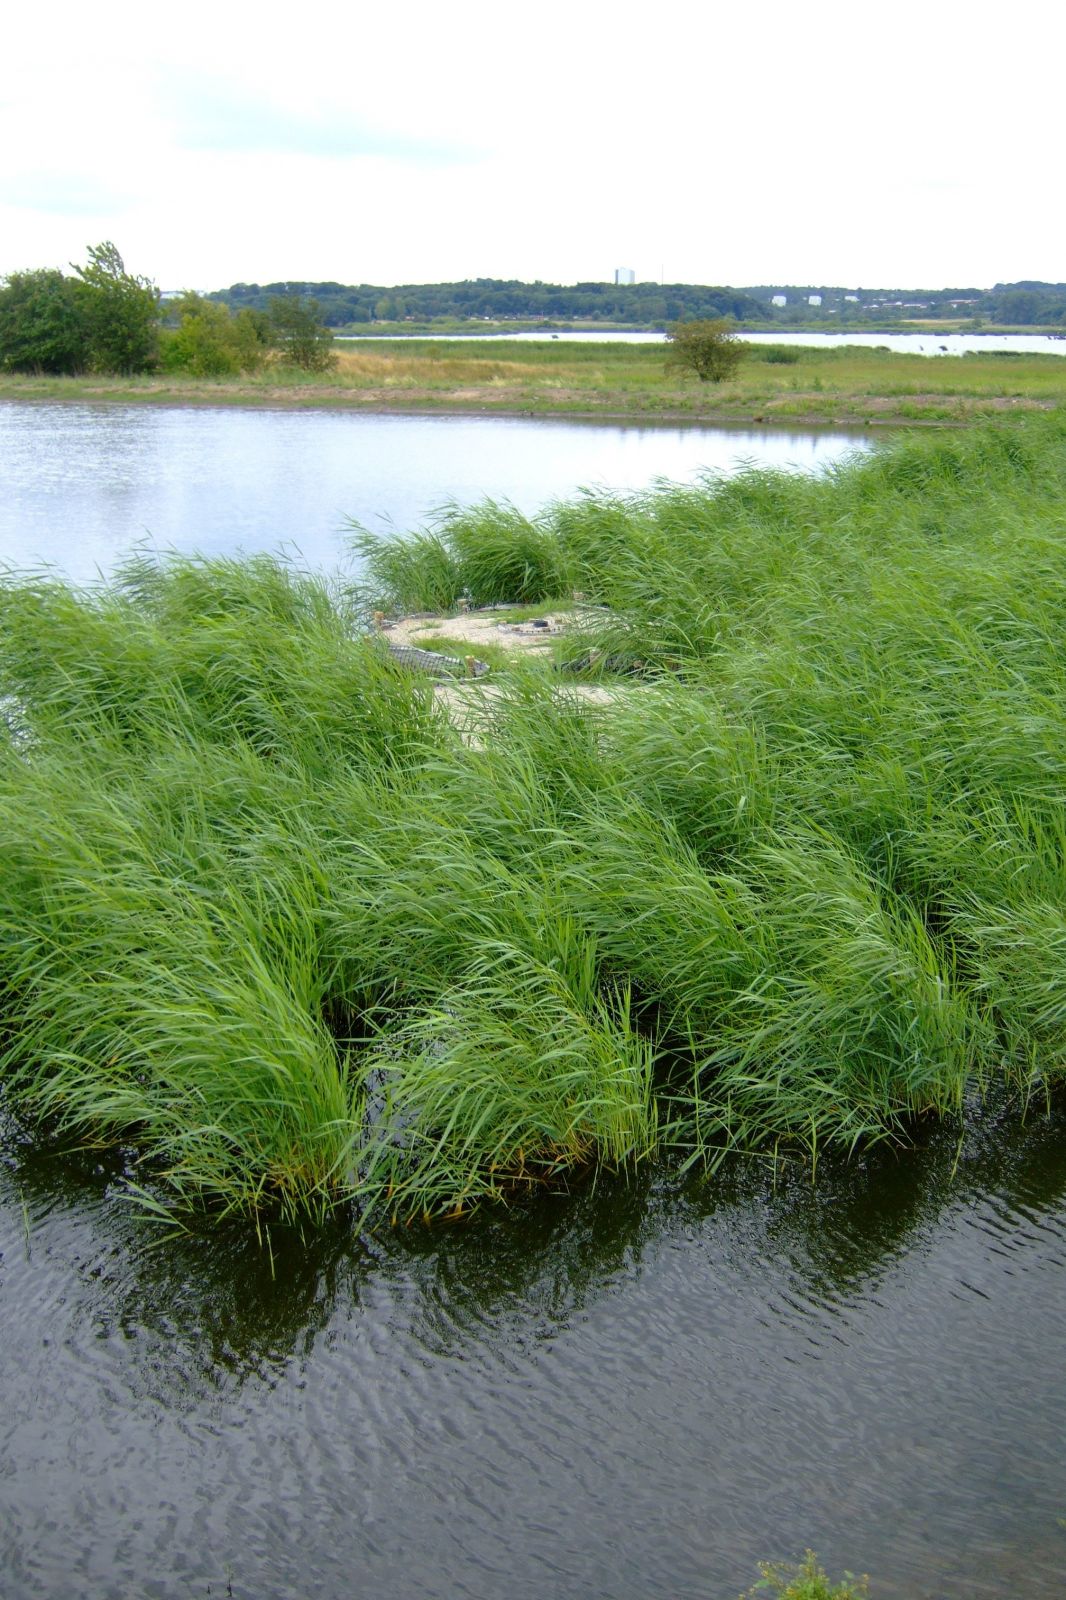
Left: Improved retention basin in Aarhus. Center: showing the sand filter. Photos: http-//galleri.life-treasure.dk Right: Cross section of a sand filter at the outlet of a retention pond.
In the first image above you can see that the basin is a compromise between a detention basin and a FWS wetland. Notice that the side slopes are steep and have not been vegetated but that the wetland plants in the sand filter are thriving. In the last image above you can see that the sand filter is level with the permanent pool elevation and slopes to the bottom of the basin. The area of the filter is 4,300 square feet. Both the surface of the filter and most of the below water sand face were planted with Phragmites.
Study Questions
True/False. The FWS wetland is an approbate choice for secondary treatment of wastewater in the public landscape.
How many square feet per person served is required for proper sizing of FWS wetlands intended to treat domestic wastewater to secondary standards?
The FWS wetland in Cle Elum, Washington achieve a BOD removal percentage of _________ and a TSS removal percentage of _________.
How does the mass loading rate help designers to size FWS wetlands for nutrient removal?
If the effluent from VSSF wetland includes 31 mg/L of nitrate and the volume of water to be treated is 20,000 liters what is the required size of the FWS wetland (note: there are 453,592 mg per pound).
True/False. A properly functioning FWS wetland will remove nutrients and coliform bacteria to 50% of the background level.
What kind of outlet structure was used on the Dye Branch stormwater wetland cells?
What element was added to the retention basin in Aarhus, Denmark to cause it to behave more like a hybrid wetland and treat dissolved pollutants?
References
D. Hammer, “Low Temperature Effects on Pollutant Removal at Minot’s Wetland,” in Natural Wetlands for Wastewater Treatment In Cold Climates, Boston: Wit Press, 2002.
J. M. Hathaway and W. F. Hunt, “An Evaluation of the Dye Branch Wetlands,” North Carolina State University, Biological and Agricultural Engineering, 2009
D. Istenič, C. A. Arias, J. Vollertsen, A. H. Nielsen, T. Wium-Andersen, T. Hvitved-Jacobsen, and H. Brix, “Improved urban stormwater treatment and pollutant removal pathways in amended wet detention ponds,” J. Environ. Sci. Health Part A, vol. 47, no. 10, pp. 1466–1477, Aug. 2012.
NEPIS. Wastewater Technology Fact Sheet Free Water Surface Wetlands. 2000. http://nepis.epa.gov/Exe/ZyPURL.cgi?Dockey=P1000ZQD.txt
L. Zhang, “Effect of Limited Artificial Aeration on Constructed Wetland Treatment of Domestic Wastewater,” Desalination, vol. 250, pp. 915–920, 2010.
http://www.programmed.com.au/property-services-blog/the-little-known-benefits-of-constructed-wetlands.