Stormwater Runoff Characteristics

Stormwater pollution. Photo: Austin, 2013
Review the Stormwater Quality Introduction Tutorial that you studied two weeks ago to remind yourself of the water quality issues and standards associated with urban stormwater runoff. In this tutorial we will explore the effectiveness or performance of constructed wetlands intended to improve water quality.
Wilmington, North Carolina Case Study
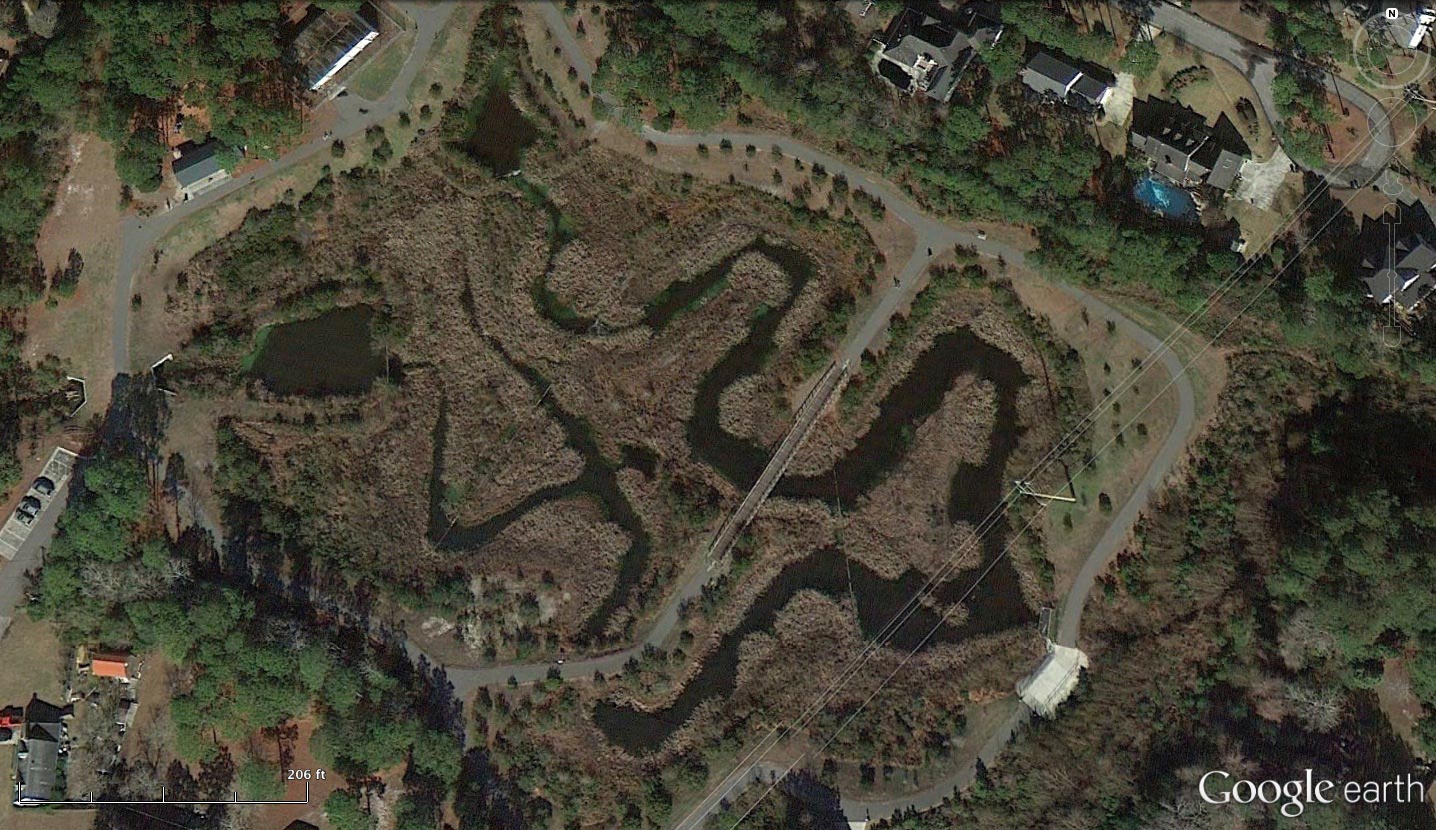
Stormwater Wetland in Wilmington, NC. Photo: 34°10'39.96" N 77°52'40.43" W, 01/03/2013, [accessed 04/25/2013] by Google earth ©Google 2013, ©TerraMetrics 2013.
The example presented here shows the performance of a Free Water Surface constructed wetland for water quality improvement. In 2007, a 11.5-acre wetland and park was constructed in Wilmington, North Carolina. The wetland (including the upland recreation area) represents less than 1 percent of its drainage area but treats 47 percent of its potential runoff. The wetland was designed for a 1” water quality storm but can contain and convey storms up to the 100-yr, 24-hour rainfall.
Eight storms, ranging from 0.4” to 1.4”, were monitored for six-hour durations. The wetland dramatically reduced both the rate and volume of the stormwater runoff. The wetland retained an average of 63 percent of the storm inflow. The average inflow of 15,185 cubic feet per hour was reduced by the wetland to an outflow of 4,944 ft3 per hour.
The primary water quality deficit in the stormwater was pathogenic bacteria. High bacteria levels had caused the closure of shellfish harvesting in the downstream tidal stream reach. The stormwater wetland decreased the fecal coliform bacteria an average of 99 percent. In the wetland outflow coliform bacteria was less than the 200 cfu/100mL (cfu = colony forming units) standard for human contact. When total suspended solids (TSS) concentrations were highest in the inflow, the wetland removed 98.8 percent of TSS.
The Wilmington wetland removed more that 90 percent of the ammonium and orthophosphate, and 89 percent of the total phosphorus. Nitrate removal was very high, especially in the warmer months. It is important to remove nitrates from stormwater since it is toxic to aquatic organisms, causes algae blooms in lakes and the ocean and is a human health risk in drinking water. The EPA drinking water standard for nitrate is 1 mg/L but it is harmful to newborn babies and can cause algae blooms at much smaller concentrations. Total nitrogen removal ranged from 66 to 96 percent.
The excellent performance of this stormwater wetland is the result of several design factors. In the aerial view of the wetland (above) the two, six-foot deep, forebays are visible. These are necessary to allow sediment to settle from the two stormwater inflow points. This wetland also features a weir that distributes the stormwater inflow evenly across the wetland which is densely vegetated with a diversity of plants (Mallin, 2012).
Factors Influencing Bacteria Removal
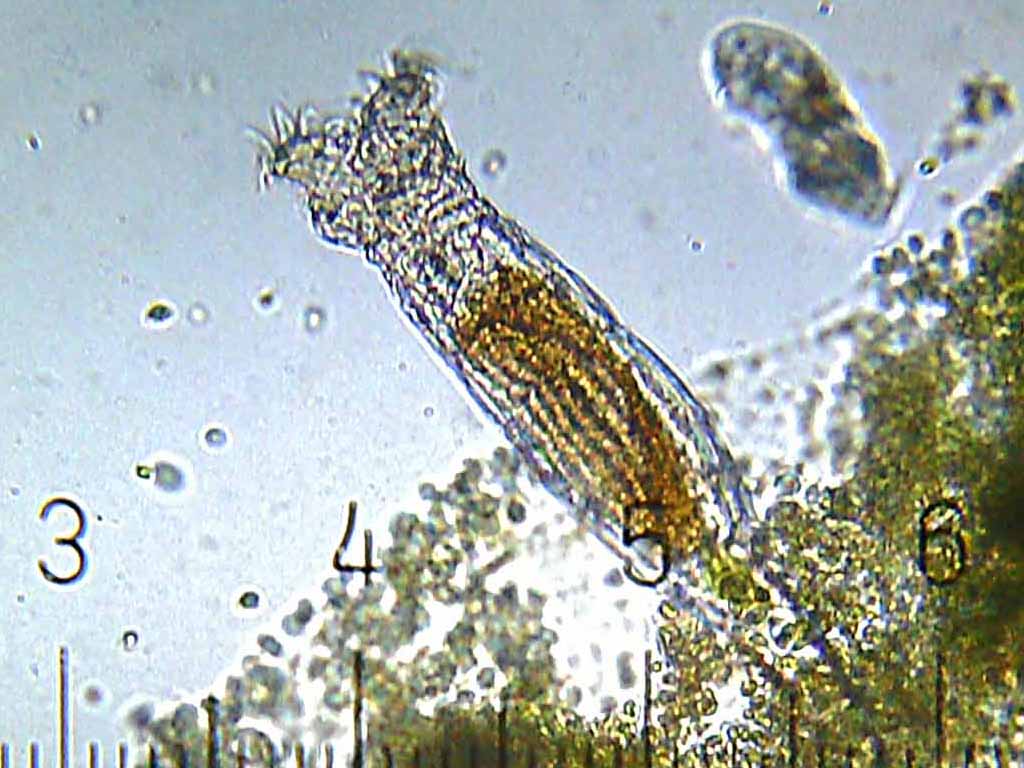
Rotifer. Image: Bob Blaylock, license CC-SA 3.0
Removal of bacteria pathogens in Free Water Surface (FWS) and other wetland types is highly dependent on residence time and internal flow patterns. Rotifers and protozoa are microorganisms that prey on bacteria. Rotifers are abundant in the outflow of treatment wetlands. They are commonly present at 10 per milliliter. At this concentration rotifers can disinfect stormwater detained for 1.2 hours in a marsh wetland (Kadlec, 2009).
A study of two detention basins, a retention pond, two wetlands and one bioretention basin confirmed the effectiveness of FWS wetlands for bacteria removal. The detention basins actually increased the concentration of harmful bacteria while one wetland met EPA recommendations for primary recreation contact for E. coli and fecal coliform. The bioretention bed met EPA recommendations for primary recreation contact for E. coli and nearly met the standard for fecal coliform concentration (Hathaway, 2009).
Stormwater Wetland Design
Stormwater Wetland in Wilmington, NC. Photo: 34°10'39.96" N 77°52'40.43" W, 01/03/2013, [accessed 04/25/2013] by Google earth ©Google 2013, ©TerraMetrics 2013.
The Wilmington wetland illustrates the basic elements of a stormwater wetland. Water should enter the wetland at one end and flow into a sedimentation basin. These are deep basins that may be normally dry. The heaviest particles settle to the bottom of the sedimentation basin, carrying bacteria and heavy metals attached to them. The sedimentation basin or forebay must be cleaned out after a few years for continued water quality performance of the wetland.
Healthy, dense vegetation is a critical feature of a stormwater wetland. In the Wilmington case, the ground water is high enough that it provides a minimum level of water for the wetland and low flow channels through the wetland.
The stormwater must be evenly distributed across the wetland. At Wilmington this is done with notched weirs at the outlet of each sedimentation basin and along a third weir that crosses the entire wetland.
The water quality storm flow must be shallow and move slowly through the wetland to receive maximum contact with the stems of the wetland plants and bottom sediment. The microorganisms and bacteria establish an ecosystem that utilizes the organic material, ammonium, nitrates, phosphorus and even complex and toxic organic compounds, such as petroleum hydrocarbons.
The wetland should be constructed with a flat or minimal slope (0.5 to 1 percent). The water flowing through the wetlands will seek preferential routes across the wetland, which decreases the treatment effectiveness. Therefore, the shape of the wetland should not be long and narrow, but roughly circular or square, as in the Wilmington example.
The water depth should vary from 6” to 18” deep for the water quality storm. As you saw in the Chino Creek Wetland, sometimes deeper (4’) trenches are placed across the flow path to encourage mixing, redistribution of water, and to provide cooler water for fish habitat. In the Wilmington example, the sinuous route of the low flow channel extends the length of the pathway through the wetland and crosses the storm flow to encourage the distribution of flow through the vegetation.
There is a small pool at the outlet of the Wilmington wetland where an overflow structure controls the normal depth of water in the wetland and the depth for storms greater than the water quality storm. This structure releases water at the predevelopment rate for the larger storms (10 or 25-year storms typically). Ideally, the stormwater wetland has an area large enough to hold the volume of several water quality storms with a depth of 18”. The entire wetland is contained by a berm that prevents stormwater from flowing into the basin. In the case of Wilmington, the berm are high enough to hold the 100 year storm until it can drain into the receiving stream.
Mosquitoes
Mosquito are potentially a problem in stormwater wetlands. However, highly functioning wetland ecosystems significantly limit the population of mosquito. High plant diversity leads to greater numbers and diversity of predatory insects, which reduce the number of mosquito larva in marsh wetlands compared to open water ponds without vegetation. Very shallow water and dense vegetation, such as cattail, encourage the development of larva and reduce predation by fish and insects. Mosquito fish and any other carnivorous or omnivorous small fish eat large numbers of larva. The flying range of adult mosquito is 100' to 300' (although wind can extend this distance, and some species have a longer flight range), so placement of the wetland in the watershed or buffers of recreation areas or upland habitat can control the impact of mosquito on people in residential areas.
Design Limitations
The Wilmington wetland is a shallow marsh dedicated to stormwater treatment but although is contains significant recreation amenities. Sometimes stormwater wetlands are combined with deeper open water areas to encourage boating and fishing. These are often compatible uses if the facility is carefully designed. A study of stormwater and recreation lakes in Australia demonstrated that dredging to deepen parts of the lakes resuspended sediments containing heavy metals and hydrocarbons. Where the open water was rather shallow (3' deep), high winds during storms also resuspended the contaminated sediment. Finally, vegetation management to expand the open water area compromised the stormwater treatment functions.
Edward Branch Stormwater Wetland
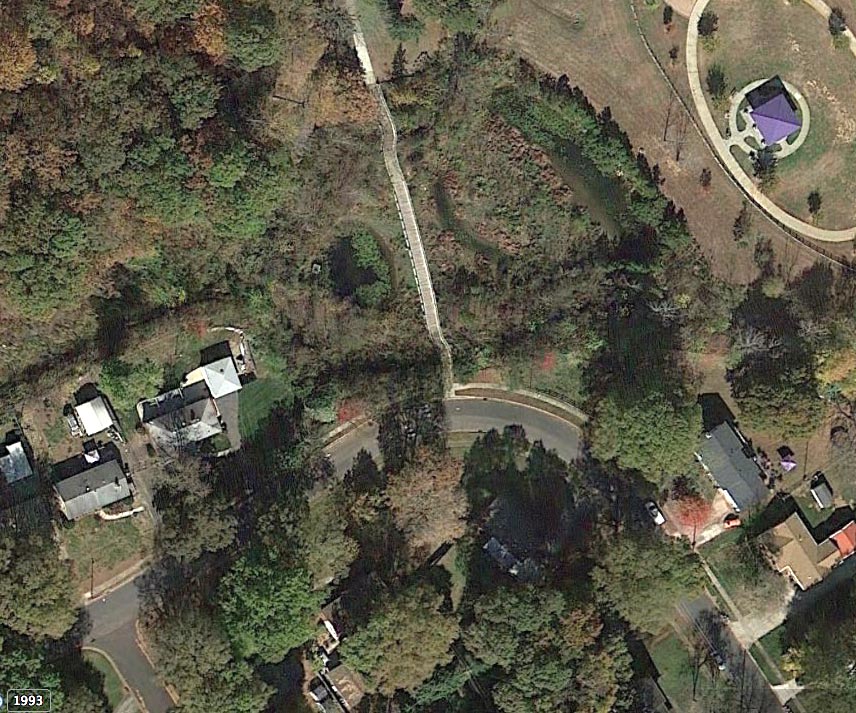
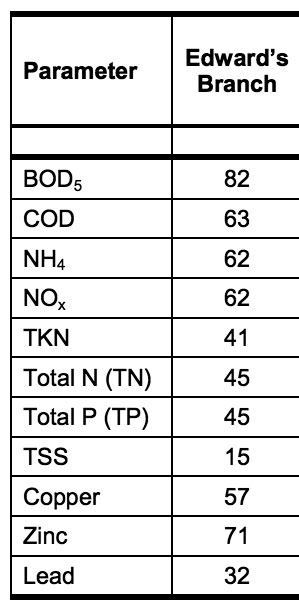
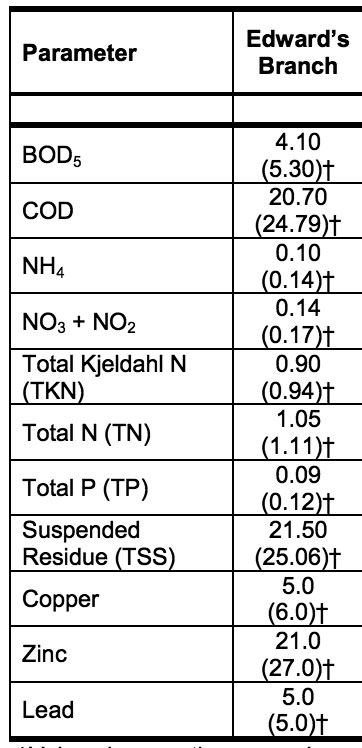
Left: stormwater wetland in 2013, Image: 35°12'21.19" N 80°46'07.54" Google Earth accessed 3/3/2014 Other images: Hathaway, 2007. The first table shows removal percentages while second table shows the concentration of contaminants.
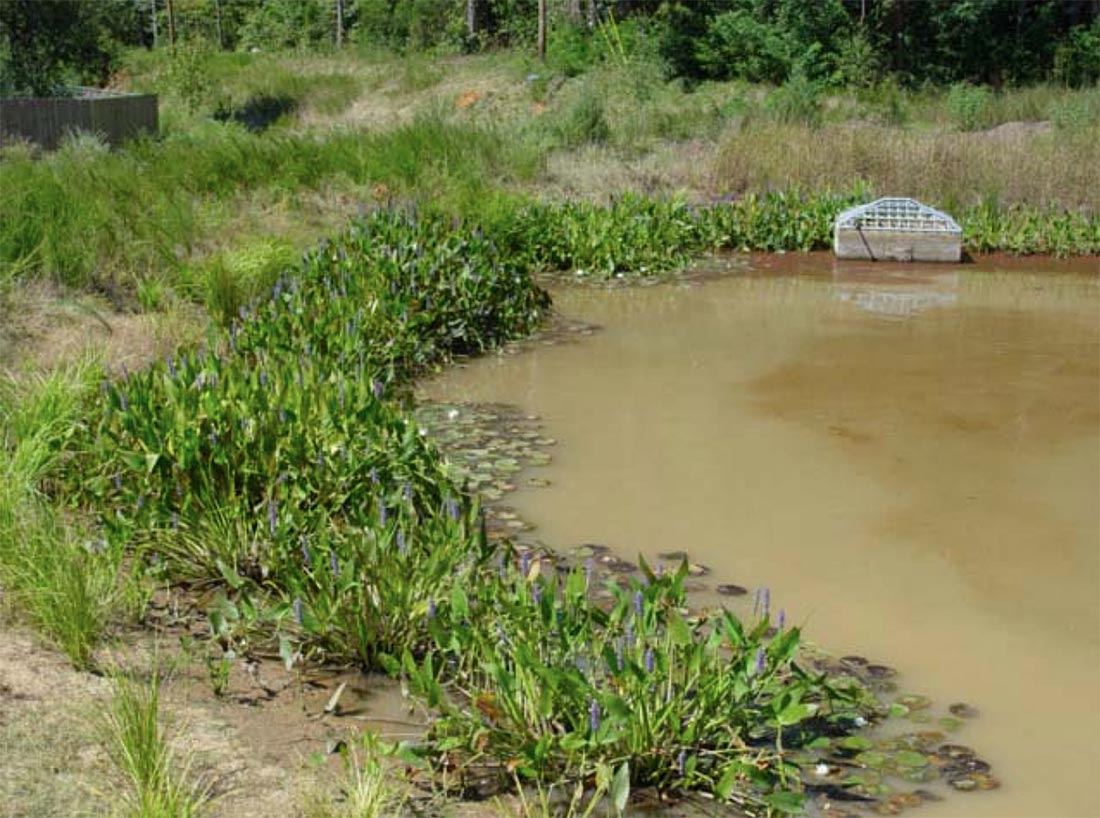
In the aerial photo you can see the wetland pool and vegetation on the left side of the walkway. In this image from 2013 the wetland and vegetation seems well established. However in the second image, the wetland is rather unattractive with only 15%-20% vegetation and high turbidity. Note the outlet strucutre in the background of the image. This 1/2-acre free water surface wetland receives stormwater from low density residential development where the lot sizes range from 1/2 to 1/4 acre. The average water depth is 18", but the design of the inlet and outlet allow for little storage of water in the wetland, meaning that the inflow and outflow rates are about equal. In fact, the wetland functions like an extended detention basin. Increasing the storage would probably improve the water quality of the effluent. Most of the current water quality improvement is from sedimentation and settling of suspended solids when the water velocity is reduced in the wetland. The small amount of vegetation in 2007 was probably the result of acidic (less than ph 5) and mineral soil rather than organic soil.
The regulatory agency (the state) anticipates that stormwater wetlands will remove 85% of the total suspended solids (TSS), 40% of the total nitrogen (TN), and 35% of the total phosphorous (TP) from the inflow. The first table above shows that in 2007 the wetland was performing above these levels with the exception of removal of total suspended solids. This may be caused by very small particle sizes (they don't precipitate from the water volume) and the lack of vegetation in the wetland. Removal of iron, and lead is also lower than would be expected. The lower lead removal is probably due to very little lead in the inflow (Hathaway, 2007).
The table, above right, shows the concentration of the pollutants in the wetland effluent (outflow).(Hathaway, 2007).
Study Questions
The Wilmington stormwater wetland decreased the fecal coliform bacteria an average of _______ percent.
Characterize the effectiveness (low, moderate, or high) of the Wilmington stormwater wetland for the removal TSS, ammonium, total phosphorus and nitrate.
What are rotifers?
What is the purpose of the the two, six-foot deep, forebays in the Wilmington stormwater wetland?
What device evenly distributes stormwater across the Wilmington stormwater wetland?
The flying range of adult mosquitoes is _________.
In the study of stormwater and recreation lakes in Australia, which two factors caused resuspension of contaminated sediment?
The Edward Branch stormwater wetland failed to meet the removal standards for TSS. List two possible causes.
Why did wetland vegetation fail to grow in the dward Branch stormwater wetland?
References
Jon Hathaway; William F. Hunt; Amy Johnson. Edwards Branch Wetland: Final Monitoring Report. Department of Biological and Agricultural Engineering, City of Charlotte Pilot BMP Monitoring Program January 2007
J. Hathaway, “Indicator Bacteria Removal in Storm-Water Best Management Practices in Charlotte, North Carolina.,” Journal of Environmental Engineering, vol. December, 2009.
R. H. Kadlec, Treatment Wetlands. Boca Raton, FL.: CRC Press, 2009.
M. A. Mallin, J. A. McAuliffe, M. R. McIver, D. Mayes, and M. A. Hanson, “High Pollutant Removal Efficacy of a Large Constructed Wetland Leads to Receiving Stream Improvements,” Journal of Environment Quality, vol. 41, no. 6, p. 2046, 2012.