MAGNETICS: |
ELECTROMAGNETICS: |
|||||
Principal Investigator: Bill Clement (BSU)
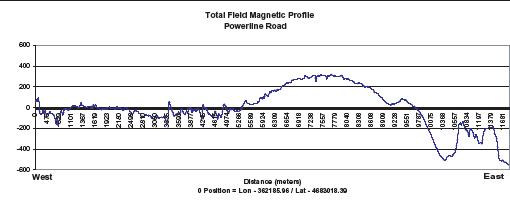
Regional and local high-resolution magnetic data have been collected within the Alvord Basin. The 3-D magnetic survey measured readings at 3425 stations with 10 m station spacing along the east-west direction and 30 m station spacing along the north-south direction. The regional total magnetic field was removed from the raw data and the residual shows a good correlation with the locations of the hot springs (see figure below).
The magnetic profile along Powerline Road supports the seismic interpretation of a mid-basin basement high. The high frequency anomalies between 3 km and 5 km suggest a magnetic disturbance due to near subsurface structure; while the broad, low frequency anomalies from 1 km to 3 km and from 5 km to 10.5 km suggest magnetic disturbances due to deep subsurface structure. The magnetic profile correlates well with the interpretation of the basin seismic reflection profile.
|
Principal Investigator: Mitch Lyle (BSU)
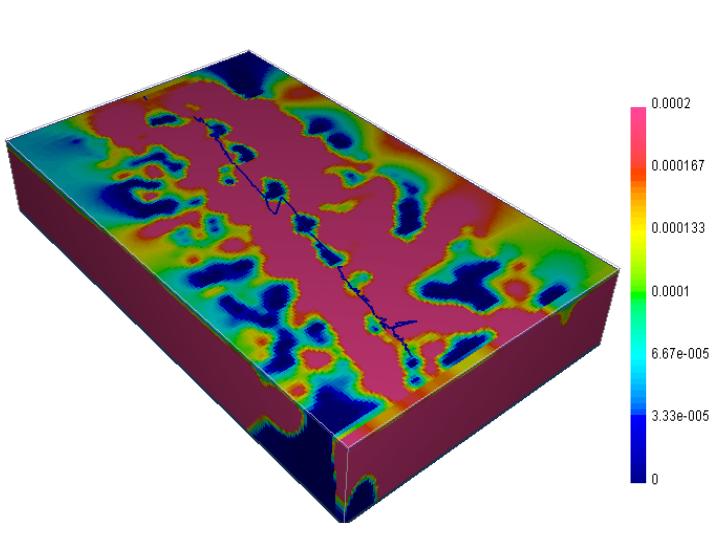
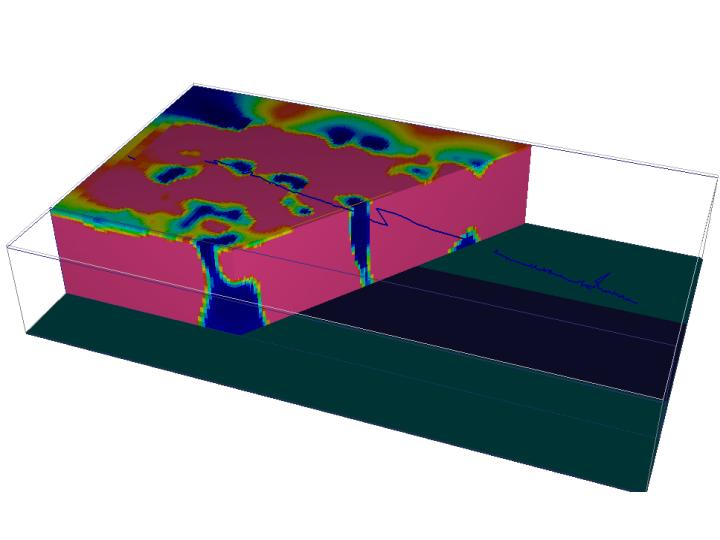
Inverted magnetic susceptibility model. The blue line indicates the line of hot springs. The perspective of the left image is looking NE, while the right image is looking ENE. [Click images to enlarge] To improve imaging capabilities, a transient electromagnetic (TEM) survey was performed in the same area as the 3-D seismic survey. The TEM method measures the conductivity of the subsurface as a function of depth by inducing an electromagnetic field into the subsurface. We conducted a 3-D TEM survey to determine the resistivity structure of the linear spring trend and to understand the left-stepping offset in spring positioning.
Preliminary results show a high resistivity layer from the surface to a depth of 3 m. A low resistivity layer exists from 3 m down to 10 m, and a layer of increased resistivity is present between 10 to 23 m depth. Assuming high resistivity correlates with low permeability and/or unsaturated conditions, a possible geologic model for this section is a thin vadose zone overlying a spring water saturated zone. Note that low resistivity zones come to the surface in the vicinity of the hot springs (near 120 m and 160 m). This most likely is the water-saturated zone, and indicates that fluids in the fault are highly conductive. A lower conductivity zone, near the center of the profile at a depth of 10-20 m, may be indicative of the underlying geologic structure. Magnetic Susceptibility Model We inverted the magnetic data to determine 3-D magnetic susceptibility distribution for the survey area. The predicted data from the model fit the observed data well given a noise assumption of 3 nT. The model from the inversion of the magnetic data shows tubular structures that start at a depth of 200 m and continue to the surface. These tubular structures are the low susceptibility zones that may represent conduits for upflowing geothermal water. The zones of low susceptibility correlate with the location of the hot springs, suggesting the validity of the magnetic inversion.
|
Life at Interfaces: Biocomplexity in Extreme Environments |
||
 |
||
|
||
|
|
||
| last update: June 2006 | webmaster: jhinds@uidaho.edu | ||